
Driven Metrics research · October 2026
Zero-click search statistics measure how often a Google search ends without the searcher clicking through to any website. A search counts as zero-click when the person reads the answer on the results page, types a new query or leaves. In the clickstream studies used here, a click to a Google property such as YouTube or Maps, or to a paid ad, still counts as a click. “Open-web clicks” means clicks to sites Google does not own, including advertisers’ sites.
This is a Driven Metrics original analysis of published data. We combined 14 sources dated August 2019 to July 2026: five SparkToro clickstream studies built on Jumpshot, Datos and Similarweb panels; iPullRank’s analysis of 13.1 billion Datos search events; a randomized field experiment by researchers at the Indian School of Business and Carnegie Mellon University; Pew Research Center browsing data; and AI Overview studies from Ahrefs, Seer Interactive and Semrush. We rebuilt 2024 baselines from published components, reweighted panel data by device, reconciled conflicting estimates and built a click-exposure estimate for AI Overviews by query type. Every derived number is labeled as a Driven Metrics calculation.
Four findings stand out. First, 68.01% of US Google searches ended without a click from January to April 2026, and Driven Metrics calculates the rise since 2024 at 9.5 points, not the 7.6 points widely cited. Second, open-web clicks fell faster than zero-click searches rose: 231 per 1,000 US searches in early 2026, down 35.8% from 360 in 2024. Third, device mix explains most of the disagreement between studies; reweighting the Datos panel to two-thirds mobile moves its US estimate to 60.3%. Fourth, query type matters more than any average: Driven Metrics estimates AI Overviews remove 23.0% to 33.6% of organic clicks from question queries but 0.4% to 0.5% from navigational queries.
Key zero-click search statistics for 2026
- 68.01% of US Google searches ended without a click to any website from January to April 2026, according to SparkToro’s analysis of Similarweb clickstream data.
- The UK had the highest zero-click rate of six markets at 69.5% and Germany the lowest at 62.1% from January to April 2026, according to SparkToro and Similarweb.
- According to a 2026 Driven Metrics analysis of SparkToro data, clicks to the open web fell from 360 to 231 per 1,000 US Google searches between 2024 and early 2026, a 35.8% decline.
- Driven Metrics calculates that the US zero-click rate rose 9.5 points, from 58.5% in 2024 to 68.0% in January to April 2026, using SparkToro’s published figures.
- US mobile Google searches ended without a click 66% of the time, versus 49% on desktop, from October 2024 to December 2025, according to iPullRank’s Datos analysis and a Driven Metrics calculation.
- In a randomized experiment run in January and February 2026, searches that showed an AI Overview ended without a website visit 73% of the time, versus 54% when the AI Overview was hidden (Agarwal and Sen).
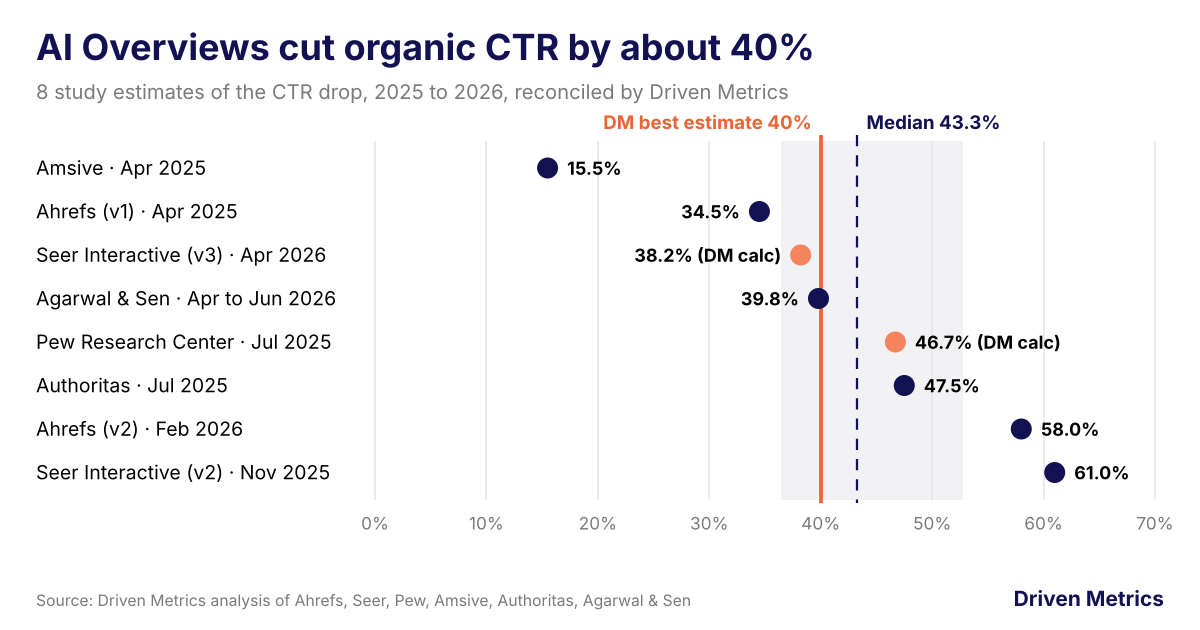
- Across five measurements published in 2025 and 2026, Driven Metrics calculates that AI Overviews cut organic clicks by a median of 46.7%.
- 92% to 94% of Google AI Mode sessions were zero-click in Semrush’s May to July 2025 US desktop clickstream data.
What percentage of Google searches are zero-click in 2026?
Driven Metrics uses 68.0% as the best estimate of the US zero-click rate in early 2026. Credible published estimates for standard Google search range from 46.96% to 69.5%, and most of that spread comes from device mix and market, not disagreement about behavior.
| Source | Segment | Period | Zero-click rate | Driven Metrics analysis |
|---|---|---|---|---|
| SparkToro / Similarweb | US, mobile and desktop browsers | Jan to Apr 2026 | 68.01% | Best estimate for the US; only 2026 cross-device panel |
| SparkToro / Similarweb | United Kingdom | Jan to Apr 2026 | 69.5% | Highest of six markets |
| SparkToro / Similarweb | Germany | Jan to Apr 2026 | 62.1% | Lowest of six markets |
| iPullRank / Datos | Global panel, 94.5% desktop | Oct 2024 to Dec 2025 | 46.96% | Desktop-weighted; not comparable to 68.01% |
| iPullRank / Datos | US mobile | Oct 2024 to Dec 2025 | 66% | 17 points above US desktop |
| iPullRank / Datos | US desktop | Oct 2024 to Dec 2025 | 49% (DM calc.) | 66% mobile minus the 17-point gap |
| Driven Metrics | Datos US, reweighted to 2/3 mobile | Oct 2024 to Dec 2025 | 60.3% | (2/3 x 66%) + (1/3 x 49%); 59.7% at a 63% mobile share |
| Agarwal and Sen | US desktop searches showing an AI Overview | Jan to Feb 2026 | 73% | 19 points above the same searches with the AI Overview hidden (54%) |
| Semrush | Google AI Mode sessions, US desktop | May to Jul 2025 | 92% to 94% | Highest of any Google surface measured |
Note: definitions differ. SparkToro counts any click, including to Google properties and ads, as a click. iPullRank counts search sessions with no organic or paid click. Agarwal and Sen count searches with no external website visit. Semrush counts AI Mode sessions with no visit to an external domain. Sources: SparkToro (June 2026), iPullRank (July 2026), Agarwal and Sen via PPC Land (July 2026), Semrush (July 2025).
The headline figure comes from SparkToro’s June 2026 study of Similarweb’s US mobile and desktop panel: 68.01% of Google searches from January to April 2026 ended without a click. SparkToro notes that the panel excludes searches inside the Google mobile app, where zero-click features are more aggressive, so the true rate is likely higher.
The lowest large-sample figure, 46.96% across 10.2 billion search sessions in iPullRank’s analysis of the Datos panel, is not a contradiction. iPullRank reports that its panel is 94.5% desktop. When Driven Metrics reweights iPullRank’s US mobile rate (66%) and US desktop rate (49%) to SparkToro’s two-thirds mobile split, the US estimate becomes 60.3%. The remaining gap to 68.01% reflects different panels, periods and click definitions.
Pew Research Center browsing data points the same way with a different method: around two-thirds of Google searches by 900 US adults in March 2025 ended with the user searching again or leaving Google rather than clicking a result link. For the wider context on AI search usage, see the Driven Metrics AI search statistics 2026 report.
How has the zero-click rate changed since 2016?
Headline figures show the US zero-click rate rising from about 45% in 2016 to 68.01% in 2026, or 2.3 points a year. Driven Metrics finds that same-panel data shows a steadier climb of about 2.2 points a year, and that the biggest jumps line up with changes in clickstream provider.
| Period | Zero-click rate | Panel | Geography | Driven Metrics analysis |
|---|---|---|---|---|
| 2016 | About 45% | Jumpshot | US | Starting point (approximate) |
| June 2019 | 50.33% | Jumpshot | US browsers | +5.3 pts vs. 2016, same panel |
| Q4 2020 | 68.3% | Similarweb | US | Provider change |
| Jan to Dec 2020 | 64.82% | Similarweb | Worldwide | Not comparable to US figures |
| 2024 (Sep 2022 to May 2024) | 58.5% | Datos | US | +8.2 pts vs. June 2019 (1.6 pts per year); provider change |
| Oct 2024 to Dec 2025 | +2.6 pts change | Datos | Global panel | 2.2 pts per year, same panel |
| Jan to Apr 2026 | 68.01% | Similarweb | US | +9.5 pts vs. 2024; -0.3 pts vs. Q4 2020 (same provider) |
| Driven Metrics: 2016 to 2026 | +23.0 pts | Mixed | US | 2.3 pts per year across three providers |
Note: each provider uses a different panel of users and devices, so cross-provider changes mix real behavior with measurement differences. Per-year rates divide the point change by the years between periods. Sources: SparkToro (August 2019, March 2021, July 2024, June 2026); iPullRank (July 2026).
SparkToro’s 2026 post calls 2024 to 2026 the fastest acceleration of zero-click searches in a decade. Driven Metrics calculates that rise at 9.5 points, using the 58.5% US figure from SparkToro’s original 2024 study. That figure matches the 2026 post’s own reported 9.51-point drop in searches with any click: 32.0% plus 9.51 points gives 41.51% clicking in 2024, or 58.49% zero-click.
Same-provider data tempers the acceleration story. Similarweb measured 68.3% of US searches as zero-click in Q4 2020, according to SparkToro’s 2021 update, and 68.01% in January to April 2026, a 0.3-point difference. Methods changed between those studies and Q4 is a seasonal quarter, so the comparison is directional. The continuous Datos panel rose 2.6 points from October 2024 to December 2025, which Driven Metrics annualizes to 2.2 points per year; December 2025, at 45.6%, was the panel’s highest month.
Our read: zero-click searches are rising at roughly 2 points a year on a constant panel. Single-year jumps of 8 to 18 points in headline comparisons mostly reflect a switch from one panel to another, so any year-over-year figure that spans two providers should be treated as directional.
Where do Google searches go instead of a website?
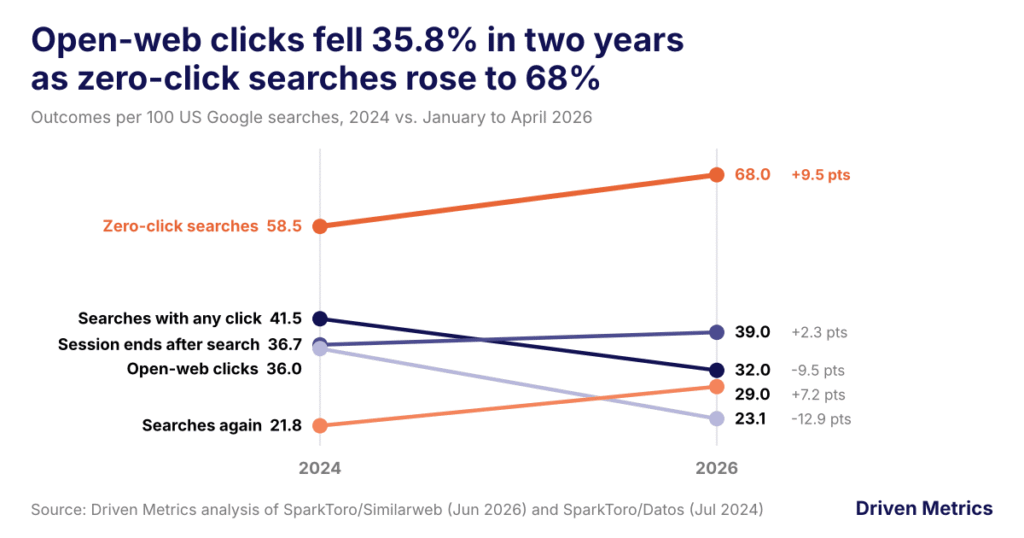
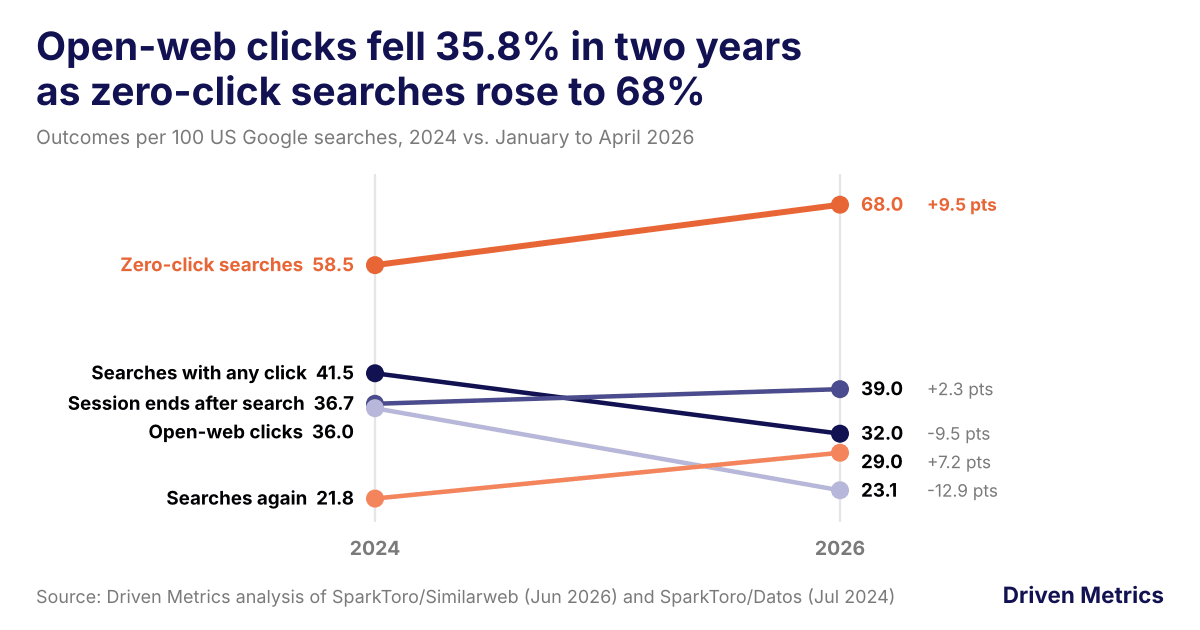
Per 100 US Google searches in early 2026, 68.0 ended without a click, 29.0 were followed by another search and only 23.1 produced a click to the open web. Driven Metrics calculates that open-web clicks fell 35.8% from 2024, more than twice the 16.2% relative rise in zero-click searches.
| Outcome per 100 US searches | 2024 | Jan to Apr 2026 | DM: change (pts) | DM: relative change |
|---|---|---|---|---|
| Searches with any click | 41.5 (DM calc.) | 32.0 | -9.5 | -22.9% |
| Zero-click searches | 58.5 | 68.0 | +9.5 | +16.2% |
| Followed by another search | 21.8 (DM calc.) | 29.0 | +7.2 | +33.0% |
| Session ends after search | 36.7 (DM calc.) | 39.0 | +2.3 | +6.3% |
| Clicks to the open web | 36.0 | 23.1 | -12.9 | -35.8% |
Note: 2024 data from the Datos panel (September 2022 to May 2024); 2026 data from Similarweb (January to April 2026). 2024 values marked DM calc. are 2026 values minus SparkToro’s reported changes (-9.51 and +7.2 points), and match the 2024 study’s rounded figures of about 22% and 37%. Open-web clicks are SparkToro’s per-1,000 figures (360 and 231) divided by 10. Sources: SparkToro (July 2024, June 2026).
The biggest behavioral shift is searchers staying inside Google, not giving up. According to SparkToro’s 2026 data, searches followed by another Google search rose 7.2 points to 29.0 per 100, while searches that ended the session rose 2.3 points to 39.0. Driven Metrics calculates a 33.0% relative increase in repeat searches over two years.
Clicks to the open web fell further than the zero-click rate rose. SparkToro reported 360 open-web clicks per 1,000 US searches in 2024 and 231 in early 2026, which Driven Metrics calculates as 129 fewer clicks per 1,000, a 35.8% decline. Part of that gap is definitional: the 2024 study counted searches with more than one click, while SparkToro says the 2026 per-1,000 figure likely undercounts them.
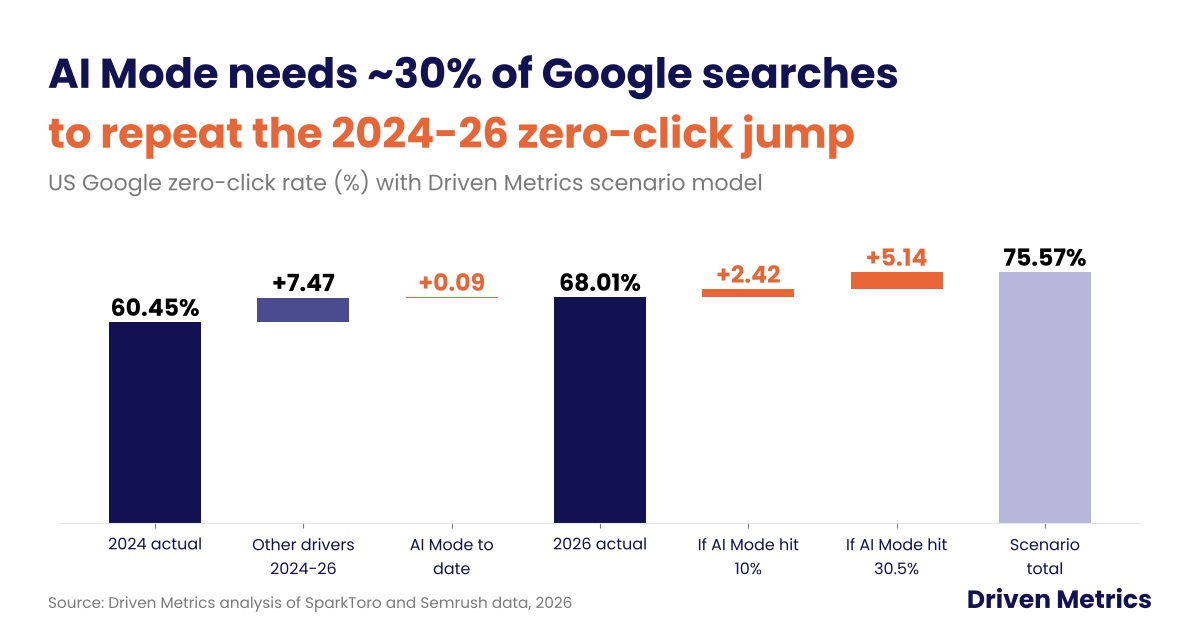
Google AI Mode was not yet a driver in this window. SparkToro found that only 0.34% of US Google searches moved into AI Mode from January to April 2026.
Zero-click search statistics by country and device
Zero-click rates vary by 7.4 points across six major markets and by up to 19 points between mobile and desktop. According to a 2026 Driven Metrics analysis of SparkToro country data, each additional point of zero-click rate is associated with about 8.1 fewer open-web clicks per 1,000 Google searches.
| Country | Zero-click rate | Searches with any click | Followed by another search | Open-web clicks per 1,000 | DM: open-web clicks vs. US |
|---|---|---|---|---|---|
| Germany | 62.1% | 37.9% | 22.5% | 287 | +24.2% (+56) |
| Italy | 63.4% | 36.6% | 24.7% | 280 | +21.2% (+49) |
| Canada | 63.8% | 36.2% | 25.6% | 268 | +16.0% (+37) |
| France | 65.3% | 34.7% | 22.9% | 271 | +17.3% (+40) |
| United States | 68.0% | 32.0% | 29.0% | 231 | Baseline |
| United Kingdom | 69.5% | 30.5% | 26.4% | 232 | +0.4% (+1) |
Note: Similarweb mobile and desktop browser panel; excludes the Google search app. Open-web clicks include clicks to organic and paid results and may slightly undercount searches with more than one click. Across the six countries, Driven Metrics’ least-squares fit gives -8.1 open-web clicks per +1 point of zero-click rate (r = -0.96). Source: SparkToro (June 2026).
Germany sends the most traffic outward: 287 open-web clicks per 1,000 searches, 56 more than the US, according to SparkToro’s six-country study. SparkToro suggests EU rules against self-preferencing may contribute, but Canada, outside the EU, sits between Italy and France, so regulation alone does not explain the spread.
| Market | Mobile | Desktop | Gap (pts) | DM: mobile-to-desktop ratio |
|---|---|---|---|---|
| United Kingdom | 65% | 46% | +19 | 1.41x |
| United States | 66% | 49% (DM calc.) | +17 | 1.35x |
| Canada | 62% | 47% (DM calc.) | +15 | 1.32x |
| Australia | 64% | 49% (DM calc.) | +15 | 1.31x |
| Indonesia | 55% | 49% | +6 | 1.12x |
| Worldwide, 2020 (Similarweb) | 77.22% | 46.47% (DM calc.) | +30.75 | 1.66x |
Note: first five rows are the Datos panel, October 2024 to December 2025 (iPullRank, July 2026); desktop rates marked DM calc. are the published mobile rate minus the published gap. The 2020 row is Similarweb data via SparkToro (March 2021); desktop = 100% minus 50.75% organic CTR minus 2.78% paid CTR.
The mobile penalty is concentrated in English-speaking markets. iPullRank found the UK, US, Canada and Australia had mobile-desktop gaps of 15 to 19 points, while Indonesia, the Philippines, Vietnam and Japan sat near 6 points. In five markets, more than 60% of mobile searches ended without a click, led by the US at 66%.
The gap has narrowed since 2020, when Similarweb measured 77.22% of mobile searches and, by Driven Metrics’ calculation, 46.47% of desktop searches as zero-click worldwide. Because most searches happen on phones, device mix is the single biggest reason two studies of the same year can disagree by 20 points.
Which searches still get clicks?
Navigational, transactional, local and branded searches still send clicks. Driven Metrics estimates that AI Overviews remove 0.4% to 0.5% of organic clicks from navigational queries and 0.8% to 1.2% from transactional queries, against 23.0% to 33.6% from question queries.
| Query segment | AIO trigger rate (Ahrefs, Sep 2025) | AIO prevalence (Seer, 2025 to Feb 2026) | DM: est. clicks lost, low | DM: est. clicks lost, high |
|---|---|---|---|---|
| Question queries | 57.9% | 85.9% | 23.0% | 33.6% |
| Queries of 7+ words | 46.4% | n/a | 18.5% | 26.9% |
| Non-branded | 24.9% | n/a | 9.9% | 14.4% |
| Informational intent | 21.4% | 36% | 8.5% | 12.4% |
| All keywords | 20.5% | n/a | 8.2% | 11.9% |
| Branded | 13.1% | n/a | 5.2% | 7.6% |
| Local searches | 7.9% | n/a | 3.1% | 4.6% |
| Commercial intent | 4.3% | 8% | 1.7% | 2.5% |
| Transactional intent | 2.1% | 5% | 0.8% | 1.2% |
| Navigational intent | 0.9% | n/a | 0.4% | 0.5% |
Note: Ahrefs data covers 146 million desktop results pages; keywords can carry more than one intent label, so segments overlap. Seer data covers 49,358 tracked queries across 53 brands. DM low = Ahrefs trigger rate x 39.8% (the outbound organic click reduction when an AI Overview appears, Agarwal and Sen, 2026). DM high = trigger rate x 58% (Ahrefs position 1 CTR reduction, December 2025). Both assume the average effect applies within each segment.
The pattern matches SparkToro’s June 2026 conclusion that branded, local and high-intent transactional searches still reward SEO. Ahrefs found AI Overviews on 0.9% of navigational keywords, 2.1% of transactional keywords and 7.9% of local searches in September 2025, against 57.9% of question queries, a 64-to-1 ratio between question and navigational queries by Driven Metrics’ calculation.
The field experiment points the same way. In PPC Land’s report on Agarwal and Sen’s paper, informational queries, 71% of the searches studied, showed a large and statistically significant drop in clicks when an AI Overview appeared, while effects on navigational (18%) and transactional (12%) queries were not distinguishable from zero.
Destination matters too. iPullRank found that Google answered 30.5% of the searches that would otherwise lead to Wikipedia and 33.4% of those leading to IMDb, against 14.2% for Reddit, 12.7% for GitHub and 11.1% for OpenAI. Sites that offer something a summary cannot replace, such as discussion, code or a product, keep their clicks.
These estimates are conservative for content-heavy sites. Seer measured AI Overviews on 36% of informational queries and 85.9% of question queries in its client data, well above Ahrefs’ keyword-level rates. Teams that rely on informational traffic typically pair generative engine optimization with a traditional SEO program aimed at the transactional and branded queries that still click.
How much do AI Overviews and AI Mode add to zero-click searches?
According to a 2026 Driven Metrics analysis of four studies, AI Overviews cut organic clicks by a median of 46.7% where they appear. Using the only randomized test, Driven Metrics estimates AI Overviews add about 7.8 points to the overall zero-click rate on US desktop searches, close to the 9.5-point rise measured from 2024 to early 2026.
| Study | Period | Sample | Metric | With AI feature | Without | DM: reduction |
|---|---|---|---|---|---|---|
| Agarwal and Sen | Jan 7 to Feb 10, 2026 | 1,065 US desktop users; 68,089 searches | Outbound organic clicks per search | 0.37 | 0.62 | 39.8% (reported) |
| Pew Research Center | Mar 2025 | 900 US adults; 68,879 searches | Visits with a result-link click | 8% | 15% | 46.7% |
| Ahrefs | Dec 2025 vs. Dec 2023 | 300,000 keywords | Position 1 CTR vs. forecast | 0.016 | 0.037 | 58.0% (reported) |
| Seer Interactive, brand cited | Jan to Dec 2025 | 53 brands, informational queries | Organic CTR | 2.07% | 3.35% | 38.2% |
| Seer Interactive, brand not cited | Jan to Dec 2025 | 53 brands, informational queries | Organic CTR | 0.94% | 3.35% | 71.9% |
| Driven Metrics median | 2025 to 2026 | Five measurements | Organic clicks or CTR | 46.7% | ||
| Semrush, AI Mode | May to Jul 2025 | About 69M US desktop sessions | Sessions with an external click | 6% to 8% | n/a | 92% to 94% zero-click |
Note: reduction = (without – with) / without. Agarwal and Sen’s rounded per-search inputs give 40.3%; the paper reports 39.8%. Seer values are full-year 2025 averages for informational queries; Seer notes one account makes up 47% of not-cited impressions, and excluding it gives a 1.61% CTR, a 51.9% reduction by Driven Metrics’ calculation. Sources: Agarwal and Sen (SSRN, April 2026, revised July 2026) via PPC Land; Pew (July 2025); Ahrefs (February 2026); Seer (April 2026); Semrush (July 2025).
The randomized evidence is the strongest. In Agarwal and Sen’s field experiment, hiding AI Overviews raised outbound organic clicks from 0.37 to 0.62 per search and cut the zero-click rate on affected searches from 73% to 54%, while sponsored clicks did not change. AI Overviews appeared on about 41% of searches, so Driven Metrics estimates their total effect at (73% minus 54%) x 41% = 7.8 points of zero-click rate.
The other measures differ in what they count. Ahrefs measures position 1 click-through rate, Pew measures whether a user clicked any result, and Seer Interactive measures CTR for its clients’ own pages. Taken together, Driven Metrics reads the evidence as AI Overviews roughly halving organic clicks on the searches where they appear, with a range of 38.2% to 71.9%.
Being cited inside the AI Overview helps but does not restore the old click rate. Seer found cited brands earned 2.07% organic CTR on informational queries in 2025, 120% more than uncited brands at 0.94%, yet 38% below queries with no AI Overview. Our guide to getting your brand cited in AI answers covers how to earn those placements.
Google AI Mode is the most zero-click surface measured. Semrush found 92% to 94% of AI Mode sessions ended without an external click in US desktop data from May to July 2025, and the AI Mode arm of Agarwal and Sen’s experiment showed 0.36 external clicks per search against 0.53 in the control group, a 32.1% gap by Driven Metrics’ calculation, though that arm had higher dropout. Not every dataset agrees on AI Overviews: Semrush found keywords that gained an AI Overview between May and October 2025 saw zero-click rates fall slightly, from 33.75% to 31.53%. For AI Mode advertising data, see our Google AI Mode ads statistics.
Frequently asked questions about zero-click searches
A zero-click search is a Google search that ends without a click to any website. The searcher reads the answer on the results page, searches again or leaves. In SparkToro’s studies, clicks to Google properties or paid ads still count as clicks.
68.01% of US Google searches ended without a click from January to April 2026, according to SparkToro’s analysis of Similarweb data. The UK rate was 69.5% and Germany’s was 62.1% over the same period.
Mostly because of device mix and panel. iPullRank’s 46.96% comes from a panel that is 94.5% desktop; Driven Metrics reweights its US data to two-thirds mobile and gets 60.3%. Studies also define a click differently and draw on different user panels.
Yes. In iPullRank’s Datos data from October 2024 to December 2025, 66% of US mobile searches were zero-click versus 49% of desktop searches by Driven Metrics’ calculation. The gap was 19 points in the UK and about 6 points in several Asian markets.
Yes, on the searches where they appear. A randomized experiment in early 2026 found zero-click searches at 73% with AI Overviews versus 54% without, and Driven Metrics calculates a median 46.7% cut in organic clicks across five measurements.
Navigational, transactional, local and branded searches. AI Overviews appeared on 0.9% of navigational and 2.1% of transactional keywords in September 2025, according to Ahrefs, so Driven Metrics estimates they remove only 0.4% to 1.2% of organic clicks from those queries.
Methodology
Sources combined: 14 published sources dated August 13, 2019 to July 30, 2026, including five SparkToro clickstream studies (Jumpshot 2019, Similarweb 2020, Datos 2024, Similarweb US 2026 and Similarweb six-country 2026), iPullRank’s Datos analysis (13.1 billion events, October 2024 to December 2025), Agarwal and Sen’s randomized field experiment (SSRN, with study details from PPC Land), Pew Research Center browsing data, Ahrefs (two studies), Seer Interactive, and Semrush (two studies).
Formulas: change in points = later rate minus earlier rate; per-year rate = point change / years; relative change = (new – old) / old; device reweighting = (mobile share x mobile rate) + (desktop share x desktop rate); derived desktop rate = mobile rate minus published gap; 2024 component values = 2026 value minus SparkToro’s reported change; open-web index vs. US = (country – US) / US; trend slope = ordinary least squares across six countries; AI Overview click loss = trigger rate x 39.8% (low) or x 58% (high); click reduction = (without – with) / without; median of five reductions; AI Overview share of zero-click = (73% – 54%) x 41%.
Limitations: panels differ in provider, device mix, geography and click definition, so cross-panel trends are directional. Most panels exclude the Google mobile app, so zero-click rates are likely floors. The click-loss model assumes average AI Overview effects apply within each query segment. Several sources are published by companies that sell SEO or analytics tools. Driven Metrics did not collect first-party search data for this report.
Have zero-click or clickstream data you can share for the next update? Contact Driven Metrics.
Sources
- In 2026, Less than One Third of Google Searches Still Send a Click. SparkToro. Rand Fishkin. June 8, 2026. https://sparktoro.com/blog/in-2026-less-than-one-third-of-google-searches-still-send-a-click/
- Zero-Click Searches: Highest in the UK, Lowest in Germany, and France has the Most Efficient Searchers. SparkToro. Rand Fishkin. June 16, 2026. https://sparktoro.com/blog/zero-click-searches-highest-in-the-uk-lowest-in-germany-and-france-has-the-most-efficient-searchers/
- 2024 Zero-Click Search Study: For every 1,000 EU Google Searches, only 374 clicks go to the Open Web. In the US, it’s 360. SparkToro. Rand Fishkin. July 1, 2024. https://sparktoro.com/blog/2024-zero-click-search-study-for-every-1000-us-google-searches-only-374-clicks-go-to-the-open-web-in-the-eu-its-360/
- In 2020, Two Thirds of Google Searches Ended Without a Click. SparkToro. Rand Fishkin. March 22, 2021. https://sparktoro.com/blog/in-2020-two-thirds-of-google-searches-ended-without-a-click/
- Less than Half of Google Searches Now Result in a Click. SparkToro. Rand Fishkin. August 13, 2019. https://sparktoro.com/blog/less-than-half-of-google-searches-now-result-in-a-click/
- What 13 Billion Google Searches Reveal About Zero-Click Behavior. iPullRank. Cate Dombrowski. July 30, 2026. https://ipullrank.com/zero-click-behavior-analysis-q3-2026
- The Impact of Google AI Overviews on Publisher Traffic and User Experience: Evidence from a Field Experiment. SSRN working paper. Saharsh Agarwal and Ananya Sen. April 3, 2026 (revised July 8, 2026). https://papers.ssrn.com/sol3/papers.cfm?abstract_id=6513059
- Researchers find Google AI Overviews cut publisher clicks 39.8%. PPC Land. Luis Rijo. July 1, 2026. https://ppc.land/researchers-find-google-ai-overviews-cut-publisher-clicks-39-8/
- Google users are less likely to click on links when an AI summary appears in the results. Pew Research Center. Athena Chapekis and Anna Lieb. July 22, 2025. https://www.pewresearch.org/short-reads/2025/07/22/google-users-are-less-likely-to-click-on-links-when-an-ai-summary-appears-in-the-results/
- Update: AI Overviews Reduce Clicks by 58%. Ahrefs. Ryan Law. February 4, 2026. https://ahrefs.com/blog/ai-overviews-reduce-clicks-update/
- What Triggers AI Overviews? 86 Factors and 146 Million SERPs Analyzed. Ahrefs. Ryan Law. November 10, 2025. https://ahrefs.com/blog/ai-overview-triggers/
- AIO Impact on Google CTR: 2026 Update. Seer Interactive. Tracy McDonald, Hannah Cooley and Marketa Williams. April 24, 2026. https://www.seerinteractive.com/insights/aio-impact-on-google-ctr-2026-update
- Google AI Mode’s Early Adoption and SEO Impact. Semrush. Luke Harsel. July 30, 2025. https://www.semrush.com/blog/google-ai-mode-seo-impact/
- Semrush AI Overviews Study: What 2025 SEO Data Tells Us About Google’s Search Shift. Semrush. Jana Garanko. December 15, 2025. https://www.semrush.com/blog/semrush-ai-overviews-study/