
AI search statistics for 2026 describe how many people use AI tools to find information, how often Google shows AI-generated answers, and what those answers do to clicks and website traffic. In this report, “AI search” covers two things: standalone AI assistants such as ChatGPT, Gemini, Perplexity and Copilot, and the AI features inside Google Search, mainly AI Overviews and AI Mode.
The figures below come from publicly available research published between July 2025 and September 2026. Sources include company disclosures from OpenAI and Google, surveys from Pew Research Center and BrightLocal, a randomized field experiment by researchers at the Indian School of Business and Carnegie Mellon University, clickstream analysis from SparkToro and Similarweb, and large studies from Ahrefs, Semrush, SE Ranking and Adobe. Every figure is dated and linked to the page where it was first published. When studies measure different things, the difference is explained instead of averaged.
The headline numbers: ChatGPT passed 900 million weekly active users in February 2026, according to OpenAI. Google said in May 2026 that AI Overviews had more than 2.5 billion monthly users and AI Mode had passed 1 billion. Pew Research Center found that 49% of U.S. adults used AI chatbots in February 2026, up from 33% in 2024. And 68.01% of U.S. Google searches ended without a click from January to April 2026, up from 60.45% in 2024, according to SparkToro.
Key AI search statistics for 2026
- ChatGPT had more than 900 million weekly active users and more than 50 million consumer subscribers as of February 27, 2026, according to OpenAI.
- Google AI Overviews had more than 2.5 billion monthly active users, and Google AI Mode had passed 1 billion monthly active users, as of May 19, 2026, according to Google CEO Sundar Pichai.
- 49% of U.S. adults said they use AI chatbots in Pew Research Center’s February 2026 survey of 5,119 adults, up from 33% in 2024.
- 60% of U.S. adults said they read AI summaries at the top of search results in Pew Research Center’s February 2026 survey.
- 68.01% of U.S. Google searches ended without a click from January to April 2026, up from 60.45% in 2024, according to SparkToro’s analysis of Similarweb clickstream data.
- Google AI Overviews reduced outbound organic clicks by 39.8% on queries where they appeared, in a randomized field experiment with 1,065 U.S. Chrome users run in January and February 2026 (Agarwal and Sen, revised June 2026).
- AI platforms sent 0.32% of all website visits from January to April 2026, up from 0.02% in 2024, across 101,574 websites tracked by SE Ranking.
- AI-referred visits to U.S. retail sites converted 60% better than non-AI visits in July 2026, according to Adobe Analytics.
How many people use AI search in 2026?
Google’s AI features have the widest reach because they sit inside regular Google results, while ChatGPT is the largest standalone AI assistant. The table shows the most recent user counts each company has published.
AI Search Platform Reach, 2026 (Company-Reported)
| Platform | Reported users | Metric | Date | Source |
|---|---|---|---|---|
| Google AI Overviews | 2.5 billion+ | Monthly active users | May 2026 | Google, I/O 2026 keynote |
| Google AI Mode | 1 billion+ | Monthly active users | May 2026 | Google, I/O 2026 keynote |
| Gemini app | 950 million+ | Monthly users | July 2026 | Alphabet Q2 2026 call, via TechCrunch |
| ChatGPT | 900 million+ | Weekly active users | February 2026 | OpenAI |
Note: Figures are self-reported by each company and use different metrics. Weekly and monthly active users are not directly comparable. Perplexity and Microsoft have not published comparable user counts on pages verified for this report.
Google AI Overviews reached more than 2.5 billion monthly active users by May 19, 2026, according to Sundar Pichai’s I/O 2026 keynote. In the same keynote, Pichai said AI Mode passed 1 billion monthly active users within a year of launch. Google’s head of Search, Liz Reid, wrote that AI Mode queries had more than doubled every quarter since launch.
ChatGPT reported more than 900 million weekly active users on February 27, 2026, up from 800 million in October 2025, according to OpenAI and TechCrunch. OpenAI also reported more than 9 million paying business users at that time.
The Gemini app grew from 400 million monthly active users at I/O 2025 to more than 900 million at I/O 2026, according to Google. Alphabet then reported more than 950 million monthly Gemini users on its Q2 2026 earnings call in July 2026, according to TechCrunch.
How do Americans use AI chatbots and AI summaries?
About half of U.S. adults use AI chatbots, and searching for information is the most common reason. More people encounter AI search through AI summaries in regular search results than through chatbots.
U.S. Adult AI Search Behavior, February 2026 (Pew Research Center, n=5,119)
| Measure | Share of U.S. adults |
|---|---|
| Ever use AI chatbots | 49% (33% in 2024) |
| Use AI chatbots daily | 24% |
| Use chatbots to search for information | 42% |
| Read AI summaries at the top of search results | 60% |
| Do not read AI summaries | 30% |
| Not sure whether they read AI summaries | 10% |
| Use ChatGPT | 44% |
| Use Gemini | 24% |
| Use Copilot | 17% |
| Use Meta AI | 14% |
| Use Grok | 8% |
| Use Claude | 6% |
Note: Chatbot brand shares allow multiple answers and do not sum to 100%. The 2024 comparison used slightly different question wording and was asked of adults who had heard of chatbots. Source: Pew Research Center.
Searching for information is the top use of chatbots: 42% of U.S. adults said they use chatbots to search for information, compared with 38% of employed adults who use them for work tasks, according to Pew’s February 2026 survey.
44% of U.S. adults reported using ChatGPT in 2026, compared with 34% in 2025, 23% in 2024 and 18% in 2023, according to Pew. Adults under 50 were about twice as likely as adults 50 and older to use ChatGPT (57% vs. 28%).
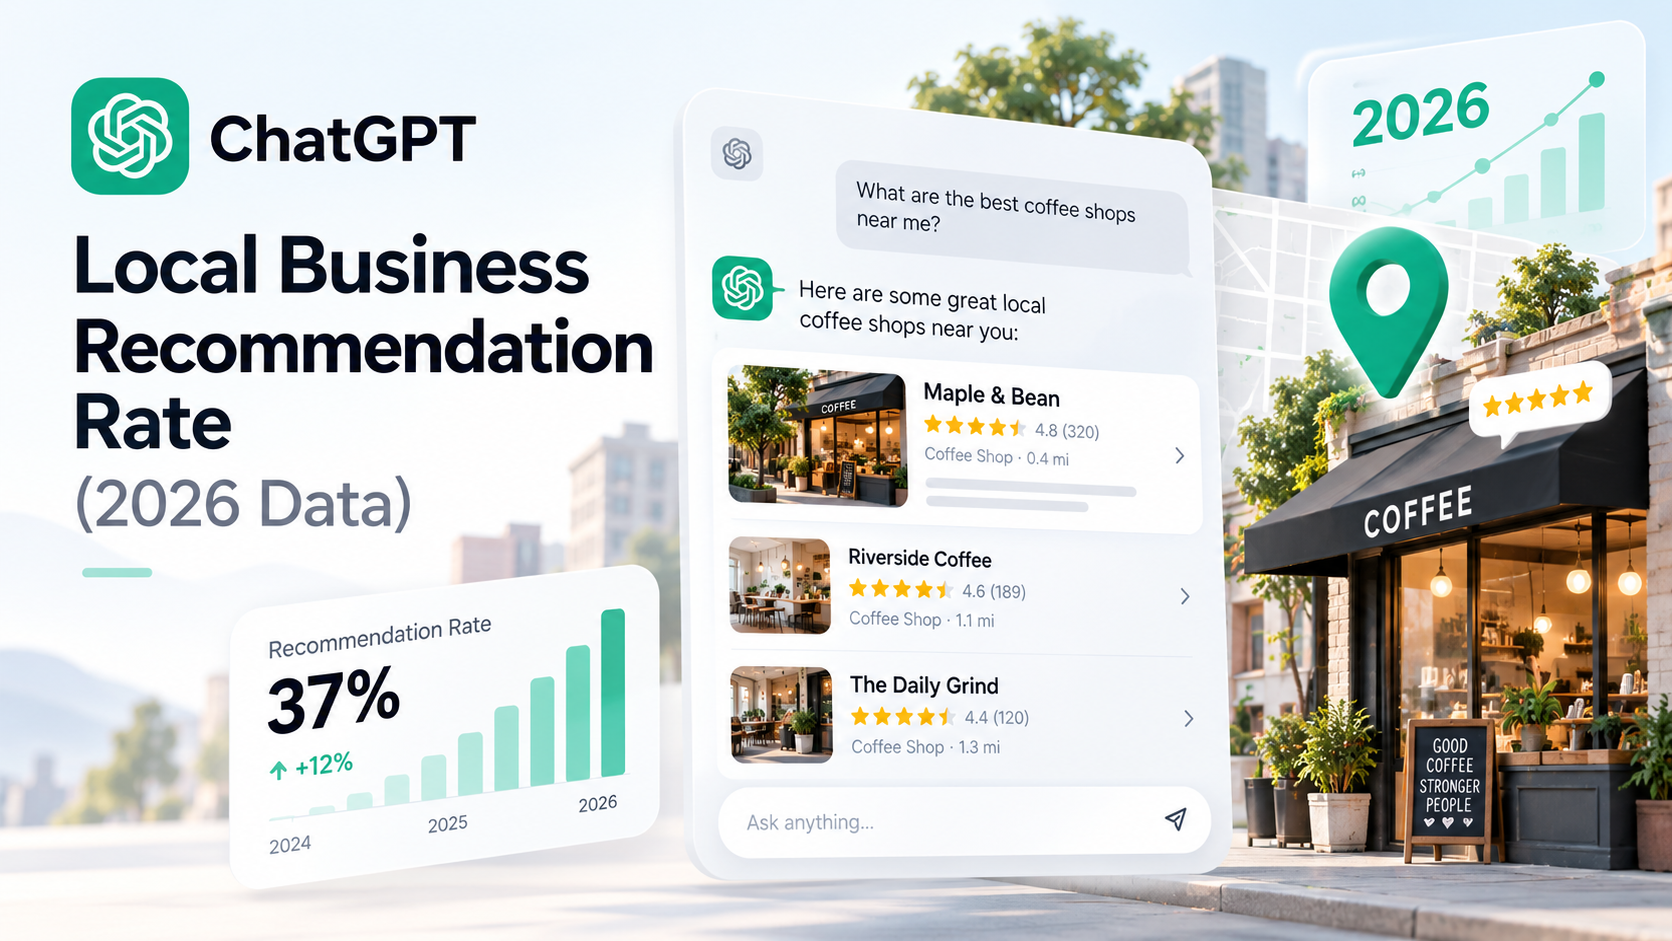
Local discovery is moving the same way. 45% of U.S. consumers said they used an AI tool for local business recommendations in the past 12 months, up from 6% in 2025, according to BrightLocal’s Local Consumer Review Survey 2026 of 1,002 U.S. adults. ChatGPT (31%) and Google AI Mode (23%) were the most-used tools for those recommendations.
How often do Google AI Overviews appear?
AI Overviews appear on about one in five Google searches in the largest keyword study, but the rate depends heavily on the type of query. Questions, long queries and informational searches trigger them far more often than local, commercial or navigational searches.
Google AI Overview Rate by Query Type (Ahrefs, 146 Million Desktop SERPs, September 2025)
| Query type | Share of results pages with an AI Overview |
|---|---|
| All keywords | 20.5% |
| Question queries | 57.9% |
| Queries of 7 or more words | 46.4% |
| Single-word queries | 9.5% |
| Informational intent | 21.4% |
| Commercial intent | 4.3% |
| Transactional intent | 2.1% |
| Navigational intent | 0.9% |
| Local searches | 7.9% |
| Non-branded keywords | 24.9% |
| Branded keywords | 13.1% |
Note: Keywords can carry more than one intent label. Data is from desktop results in September 2025, the most recent trigger study Ahrefs has published. Source: Ahrefs.
Ahrefs found AI Overviews on 20.5% of 146 million desktop search results pages in September 2025. Question queries were the strongest trigger: 57.9% showed an AI Overview, compared with 15.5% of non-question queries.
Other studies land in a similar range. Pew Research Center found that 18% of Google searches by 900 U.S. adults in March 2025 produced an AI summary, according to its browsing data analysis. Semrush tracked AI Overviews on 6.49% of keywords in January 2025, 24.61% in July 2025 and 15.69% in November 2025 across more than 10 million keywords, according to its AI Overviews study. In the Agarwal and Sen field experiment, AI Overviews appeared on about 41% of the searches participants actually ran in January and February 2026.
The experiment’s higher rate likely reflects what real people type rather than a keyword database: longer, question-style searches trigger AI Overviews most. Pew saw the same pattern, with 8% of one- or two-word searches producing a summary compared with 53% of searches of 10 or more words.
AI Overviews are also reaching further down the funnel. Among keywords that triggered an AI Overview, the share with commercial intent rose from 8.15% in October 2024 to 18.57% by late 2025, and the navigational share rose from 0.84% to 10.33% by October 2025, according to Semrush. These figures are shares of AI Overview keywords, not trigger rates.
AI search statistics by industry: which topics trigger AI Overviews most?
Science and health queries trigger AI Overviews at more than twice the overall rate, while shopping and real estate queries rarely do. The table shows Ahrefs’ category breakdown against its 20.5% baseline.
AI Overview Rate by Industry Category (Ahrefs, September 2025)
| Category | Share of results pages with an AI Overview |
|---|---|
| Science | 43.6% |
| Health | 43.0% |
| Pets & Animals | 36.8% |
| People & Society | 35.3% |
| Internet & Telecom | 30.3% |
| Reference | 30.1% |
| Computers & Electronics | 28.6% |
| Finance | 24.9% |
| Law & Government | 23.1% |
| Autos & Vehicles | 18.8% |
| Food & Drink | 18.6% |
| Beauty & Fitness | 18.4% |
| Home & Garden | 18.4% |
| Jobs & Education | 18.0% |
| Business & Industrial | 16.3% |
| Travel & Transportation | 15.7% |
| News | 15.1% |
| Sports | 14.8% |
| Real Estate | 5.8% |
| Shopping | 3.2% |
Note: Baseline across all keywords is 20.5%. Categories come from Ahrefs’ internal keyword classification; selected categories shown. Source: Ahrefs.
Science (43.6%) and Health (43.0%) queries triggered AI Overviews at more than twice the 20.5% baseline in Ahrefs’ September 2025 data. Medical “your money or your life” queries were higher still, at 44.1%.
Commerce-heavy categories sit at the bottom. Shopping queries triggered AI Overviews 3.2% of the time and Real Estate 5.8%, consistent with the low rates for transactional (2.1%) and local (7.9%) searches.
Semrush’s November 2025 data ranks categories in a similar order at lower rates: Science (25.96%), Computers & Electronics (17.92%) and People & Society (17.29%) led, while Real Estate, Shopping and Arts & Entertainment were under 3%. Because the two studies use different keyword sets and months, the ranking is more reliable than any single percentage.
How much do AI Overviews reduce clicks?
Every major study finds fewer clicks to websites when an AI Overview appears. The best estimates range from about 40% to 58% fewer organic clicks, depending on the method.
Effect of AI Overviews on Organic Clicks: Major Studies, 2025 to 2026
| Study | Method and sample | Period | Finding |
|---|---|---|---|
| Agarwal and Sen (ISB, Carnegie Mellon) | Randomized field experiment, 1,065 U.S. desktop Chrome users, 68,089 searches in the two main groups | Jan. to Feb. 2026 | Outbound organic clicks per search: 0.62 without AI Overviews vs. 0.37 with them (-39.8%). Zero-click rate: 54% vs. 73% (+34.5%) |
| Ahrefs | 300,000 keywords, aggregated Google Search Console data | Dec. 2025 vs. Dec. 2023 | Position 1 click-through rate about 58% lower when an AI Overview is present |
| Pew Research Center | Browsing data, 900 U.S. adults, 68,879 Google searches | Mar. 2025 | Clicked a traditional result on 8% of visits with an AI summary vs. 15% without |
| SparkToro / Similarweb | Clickstream panel, all U.S. Google searches | Jan. to Apr. 2026 | 68.01% of searches ended without a click (60.45% in 2024) |
Note: Per-search values in the experiment are rounded in the source; percentage changes are as reported by the authors. SparkToro measures all searches, not only those with AI Overviews.
The strongest evidence is causal. In Agarwal and Sen’s randomized experiment, AI Overviews reduced outbound organic clicks by 39.8% on queries where they appeared, while sponsored clicks did not change, according to PPC Land’s coverage of the paper’s June 17, 2026 revision. Users who saw AI Overviews reported no higher satisfaction with search than users who did not.
Ahrefs found that position 1 click-through rate fell from 0.073 in December 2023 to 0.016 in December 2025 for keywords that later showed an AI Overview, about 58% below the rate expected without one, according to its February 2026 update. The effect shrinks lower on the page: -50.8% at position 2 and -19.4% at position 10.
Pew’s March 2025 data adds that users clicked a link inside the AI summary on just 1% of visits, and ended their browsing session on 26% of pages with a summary compared with 16% without. SparkToro found that only 0.34% of U.S. Google searches moved into AI Mode from January to April 2026, so AI Mode was not yet a large driver of zero-click behavior in that period.
Not every dataset points the same way. Semrush tracked keywords before and after they gained an AI Overview between May and October 2025 and found the zero-click rate fell slightly, from 33.75% to 31.53%. That study used keyword-level clickstream data rather than a controlled test.
How much traffic does AI search send to websites?
AI platforms still send a small share of website traffic, but that share grew 16-fold between 2024 and 2026. ChatGPT sends about three quarters of it.
AI Referral Traffic Share by Platform, January to April 2026 (SE Ranking, 101,574 Websites)
| Platform | Share of AI referral traffic, global | Share of AI referral traffic, U.S. |
|---|---|---|
| ChatGPT | 74.78% | 71.33% |
| Gemini | 11.56% | 12.87% |
| Perplexity | 7.23% | 6.85% |
| Microsoft Copilot | 3.51% | 5.12% |
| Claude | 2.62% | 3.70% |
Note: Shares do not sum to 100% because smaller AI platforms are not shown. 2026 figures cover January to April 2026. Source: SE Ranking.
AI platforms accounted for 0.32% of all website visits in 2026, up from 0.24% in 2025 and 0.02% in 2024, across 101,574 websites tracked by SE Ranking. That is about 1 in every 312 visits. Organic search accounted for 42.75% of visits in the same period, about 134 times more than AI platforms, down from roughly 300 times more at the start of 2025.
ChatGPT’s share of AI referral traffic fell from 79.74% in 2025 to 74.78% in 2026, even though its referral traffic grew 27% year over year, because Gemini (up 231%) and Claude (up 320%) grew faster, according to SE Ranking.
AI citations do not simply mirror Google rankings. Across 15,000 prompts tested in July 2025, about 12% of URLs cited by AI assistants also ranked in Google’s top 10 for the same prompt, according to Ahrefs. Perplexity was the outlier, with 28.6% of its cited URLs in Google’s top 10.
Search overall has not shrunk as forecast. In February 2024, Gartner predicted that traditional search engine volume would drop 25% by 2026 because of AI chatbots. In May 2026, Google’s Liz Reid wrote that Google Search queries had reached an all-time high in the previous quarter.
Does AI search traffic convert better than other traffic?
In U.S. retail, yes. Adobe’s data shows AI-referred visits converting better than non-AI visits in every month from September 2025 to July 2026. In travel, AI visits now convert at about the same rate as other traffic.
AI-Referred vs. Non-AI Traffic on U.S. Retail and Travel Sites (Adobe Analytics, 2026)
| Metric (AI vs. non-AI traffic) | Retail, March 2026 | Retail, July 2026 | Travel, July 2026 |
|---|---|---|---|
| AI traffic growth, year over year | +269% | +62% | +119% |
| Conversion rate | 42% higher | 60% higher | 1% lower |
| Engagement rate | 12% higher | 14% higher | 21% higher |
| Time on site | 48% longer | 59% longer | 67% longer |
| Bounce rate | Not reported | 33% lower | 42% lower |
Note: Adobe compares visits from AI platforms with non-AI traffic such as paid search and email, and does not publish absolute conversion rates. Sources: Adobe, April 2026; Adobe, August 2026.
AI traffic to U.S. retail sites grew 393% year over year in Q1 2026, after a 693% increase during the November to December 2025 holiday season, according to Adobe, which analyzes more than 1 trillion visits to U.S. retail sites. Growth slowed to 62% year over year in July 2026, though AI traffic was still up 1,219% from October 2024.
Conversion reversed within a year. AI-referred retail visits converted 38% worse than non-AI visits in March 2025, 42% better in March 2026 and 60% better in July 2026, according to Adobe. In travel, AI visits converted 47% worse than non-AI visits in July 2025 and 1% worse in July 2026.
Engagement data outside retail points the same way. Visitors from AI platforms spent an average of 9 minutes 19 seconds on site, compared with 5 minutes 33 seconds for organic search visitors, according to SE Ranking. Medians were closer, at 2 minutes 24 seconds versus 1 minute 53 seconds. These figures cover January to April 2025, the most recent engagement data SE Ranking has published.
Adobe’s figures cover retail and travel only; comparable public benchmarks for B2B lead generation were not available.
Frequently asked questions
What percentage of people use AI search in 2026?
49% of U.S. adults said they use AI chatbots and 42% said they use chatbots to search for information, according to Pew Research Center’s February 2026 survey of 5,119 adults. 60% said they read AI summaries at the top of search results.
How many people use ChatGPT?
ChatGPT had more than 900 million weekly active users as of February 27, 2026, according to OpenAI. In the U.S., 44% of adults said they use ChatGPT in February 2026, up from 18% in 2023, according to Pew Research Center.
How often do AI Overviews appear in Google search?
AI Overviews appeared on 20.5% of 146 million desktop results pages in September 2025, according to Ahrefs. The rate rises to 57.9% for question queries and falls to 7.9% for local searches.
Do AI Overviews reduce website traffic?
Yes. A randomized experiment with 1,065 U.S. users in early 2026 found AI Overviews cut outbound organic clicks by 39.8% on queries where they appeared (Agarwal and Sen, revised June 2026). Ahrefs found position 1 click-through rate was about 58% lower with an AI Overview in December 2025.
Is AI search replacing Google?
Not yet. Organic search sent about 134 times more website traffic than AI platforms from January to April 2026, according to SE Ranking, and Google said its search queries hit an all-time high in early 2026. AI platforms’ share of website traffic is growing quickly from a small base: 0.32% in 2026, up from 0.02% in 2024.
Which AI platform sends the most traffic to websites?
ChatGPT sent 74.78% of AI referral traffic from January to April 2026, followed by Gemini at 11.56% and Perplexity at 7.23%, across 101,574 websites tracked by SE Ranking. Gemini and Claude were the fastest-growing sources.
How we compiled this data
This report compiles publicly available research published between July 2025 and September 2026. Each figure was traced to the page where it was first published, and the sample, period and metric definition were recorded. Company-reported user counts are shown as reported and are not independently audited. Studies that measure different things are shown side by side rather than averaged. Driven Metrics did not run any of the surveys or studies cited here. Data reviewed October 1, 2026.
Have newer data or a correction for this page? Contact Driven Metrics.
Sources
- OpenAI. “Scaling AI for everyone.” February 27, 2026. https://openai.com/index/scaling-ai-for-everyone/
- Malik, Aisha. “ChatGPT reaches 900M weekly active users.” TechCrunch, February 27, 2026. https://techcrunch.com/2026/02/27/chatgpt-reaches-900m-weekly-active-users/
- Pichai, Sundar. “I/O 2026: Welcome to the agentic Gemini era.” Google, May 19, 2026. https://blog.google/innovation-and-ai/sundar-pichai-io-2026/
- Reid, Elizabeth. “A new era for AI Search.” Google, May 19, 2026. https://blog.google/products-and-platforms/products/search/search-io-2026/
- Mehta, Ivan. “Google’s Gemini nears billion-user milestone.” TechCrunch, July 23, 2026. https://techcrunch.com/2026/07/23/google-closes-in-on-another-billion-user-product-with-gemini/
- Gottfried, Jeffrey, et al. “Americans and AI 2026: Chatbots, Smart Devices and Views on Impact.” Pew Research Center, June 17, 2026. https://www.pewresearch.org/internet/2026/06/17/americans-and-ai-2026-chatbots-smart-devices-and-views-on-impact/
- Chapekis, Athena and Anna Lieb. “Google users are less likely to click on links when an AI summary appears in the results.” Pew Research Center, July 22, 2025. https://www.pewresearch.org/short-reads/2025/07/22/google-users-are-less-likely-to-click-on-links-when-an-ai-summary-appears-in-the-results/
- Murphy, Rosie. “Nearly Half of Consumers are Asking AI for Business Recommendations.” BrightLocal, March 10, 2026. https://www.brightlocal.com/research/lcrs-ai-trust/
- Law, Ryan. “What Triggers AI Overviews? 86 Factors and 146 Million SERPs Analyzed.” Ahrefs, November 10, 2025. https://ahrefs.com/blog/ai-overview-triggers/
- Law, Ryan. “Update: AI Overviews Reduce Clicks by 58%.” Ahrefs, February 4, 2026. https://ahrefs.com/blog/ai-overviews-reduce-clicks-update/
- Linehan, Louise. “Only 12% of AI Cited URLs Rank in Google’s Top 10 for the Original Prompt.” Ahrefs, August 11, 2025. https://ahrefs.com/blog/ai-search-overlap/
- Garanko, Jana. “Semrush AI Overviews Study: What 2025 SEO Data Tells Us About Google’s Search Shift.” Semrush, December 15, 2025. https://www.semrush.com/blog/semrush-ai-overviews-study/
- Agarwal, Saharsh and Ananya Sen. “The Impact of Google AI Overviews on Publisher Traffic and User Experience: Evidence from a Field Experiment.” SSRN working paper, April 3, 2026, revised June 17, 2026. Reported in: Rijo, Luis. “Researchers find Google AI Overviews cut publisher clicks 39.8%.” PPC Land, July 1, 2026. https://ppc.land/researchers-find-google-ai-overviews-cut-publisher-clicks-39-8/
- Fishkin, Rand. “In 2026, Less than One Third of Google Searches Still Send a Click.” SparkToro, June 8, 2026. https://sparktoro.com/blog/in-2026-less-than-one-third-of-google-searches-still-send-a-click/
- Deda, Yulia. “AI traffic grew 16x from 2024 to 2026: Here are the top AI search engines driving visits to websites.” SE Ranking, June 18, 2026. https://seranking.com/blog/ai-traffic-research-study/
- Pandya, Vivek. “Adobe report: U.S. retailers see surge in AI traffic, but many websites are not entirely readable by machines.” Adobe, April 16, 2026. https://business.adobe.com/blog/ai-traffic-surge-retail-sites-not-machine-readable
- Pandya, Vivek. “Adobe report: U.S. consumers are embracing LLMs to make travel plans, but many brands have AI visibility gaps.” Adobe, August 19, 2026. https://business.adobe.com/blog/us-consumers-are-embracing-llms-to-make-travel-plans
- Gartner. “Gartner Predicts Search Engine Volume Will Drop 25% by 2026, Due to AI Chatbots and Other Virtual Agents.” February 19, 2024. https://www.gartner.com/en/newsroom/press-releases/2024-02-19-gartner-predicts-search-engine-volume-will-drop-25-percent-by-2026-due-to-ai-chatbots-and-other-virtual-agents