
Key Findings
From our analysis of 17 quarters of Amazon filings and the same-quarter results from Alphabet and Microsoft, Driven Metrics found:
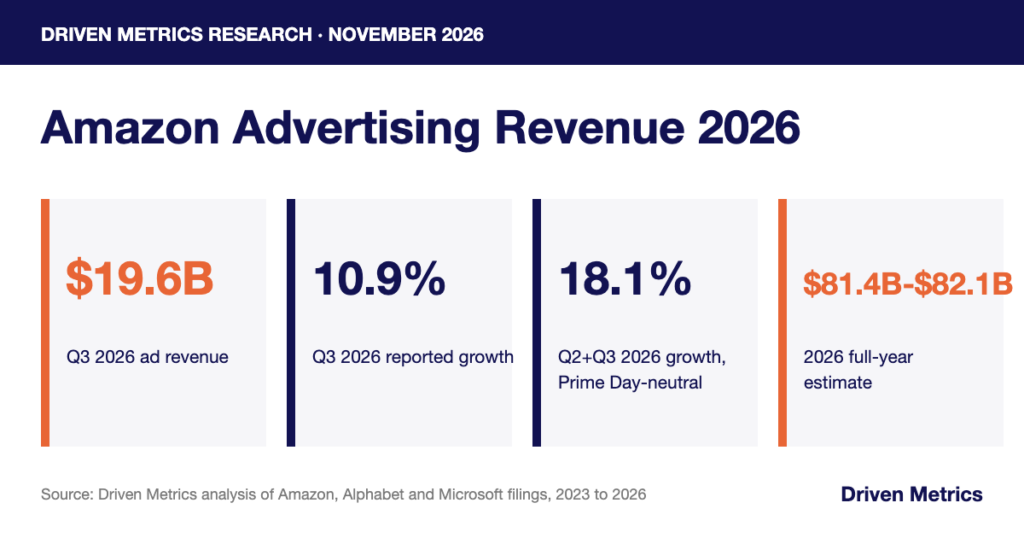
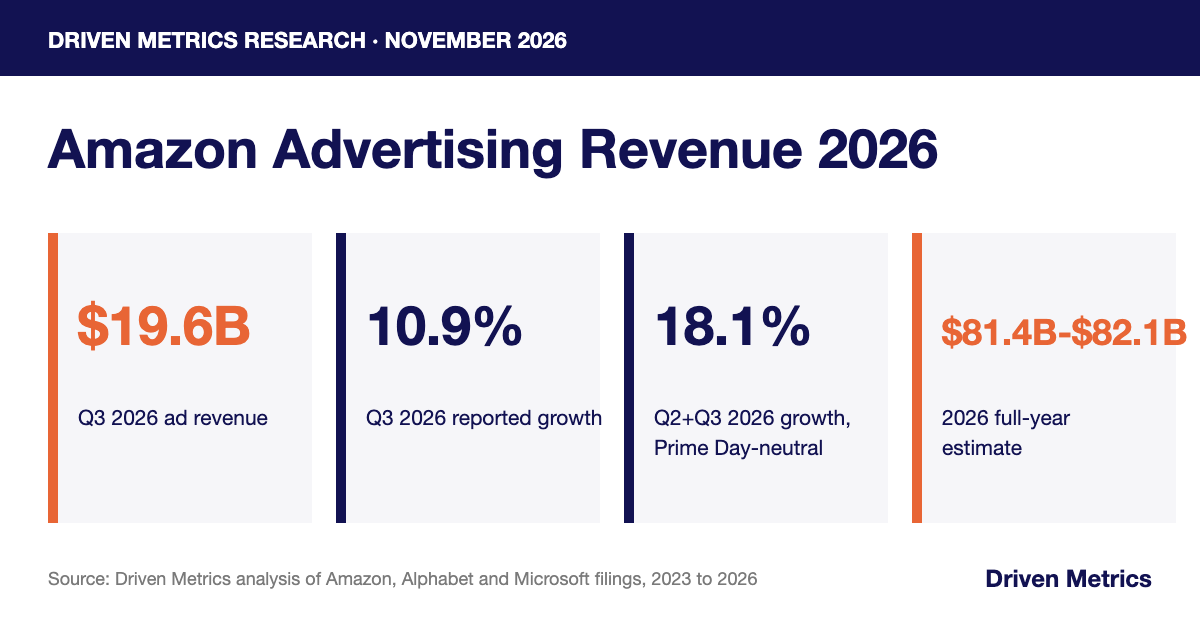
- Amazon advertising revenue 2026 reached $19.64 billion in Q3 2026, up 10.9% from $17.70 billion in Q3 2025 on a reported basis and 12% excluding currency, its slowest growth in the 13 quarters we tracked.
- Across Q2 and Q3 2026 combined, which removes Prime Day moving from Q3 into Q2, Amazon ad revenue grew 18.1%, ahead of Google Search & other at 14.3% (our calculation).
- Amazon took in $78.0 billion in advertising revenue in the 12 months ended September 30, 2026, up 20.7% year over year and equal to 9.8% of its net sales (our calculation).
- Google Search, Amazon and Microsoft each reported about 12% ad growth for the quarter ended September 30, 2026, but on three different bases. On reported revenue, the growth rates were 12.0%, 10.9% and 10.3% (our calculation).
- Reading Amazon’s “high teens” Q4 2026 guidance as 16% to 19%, Amazon’s calendar 2026 ad revenue lands between $81.4 billion and $82.1 billion, up 18.6% to 19.6% from $68.6 billion in 2025 (our calculation).
Amazon, Alphabet and Microsoft reported their quarter ended September 30, 2026 within two days of each other, on October 28 and 29, 2026. Search Engine Roundtable noted Microsoft’s 12% search and advertising growth, Amazon reported 12% ad growth excluding currency, and Alphabet reported 12% growth in Google Search & other. Three platforms on one number makes a tidy headline. The bases behind those numbers are not the same, and Amazon’s figure was pulled down by a calendar shift.
Our analysts compiled Amazon’s advertising services revenue for 17 quarters, from Q3 2022 to Q3 2026, from four Amazon earnings releases, along with Amazon’s worldwide net sales for the same quarters. We added nine quarters of Google Search & other, YouTube ads and Google Network revenue from five Alphabet releases, and nine quarters of Microsoft search and advertising revenue from Microsoft’s September 2026 restated metrics filing and its Form 10-Q for the quarter ended September 30, 2026. That gives 94 data rows. “Advertising revenue” in this report means each company’s own reported line: Amazon’s advertising services net sales, Alphabet’s Google Search & other, and Microsoft’s search and advertising revenue. “Reported growth” means growth in that revenue as stated in dollars, before any currency or partner-payment adjustment.
In the following sections, we lay out Amazon’s ad revenue by quarter and by year, separate the Prime Day effect from the Q3 2026 slowdown, compare Amazon with Google and Microsoft on one basis, size Amazon against Google Search and YouTube, and turn Amazon’s Q4 guidance into a full-year 2026 estimate.
Amazon Advertising Revenue by Quarter, Q3 2023 to Q3 2026
In the table below, we list Amazon’s advertising revenue for each quarter from Q3 2023 to Q3 2026, with our reported growth rate, Amazon’s own growth rate excluding currency, and advertising’s share of Amazon’s worldwide net sales.
| Quarter | Ad revenue ($M) | Reported y/y growth | Y/Y growth excl. currency (Amazon) | Share of Amazon net sales |
|---|---|---|---|---|
| Q3 2023 | 12,060 | 26.3% | 25% | 8.4% |
| Q4 2023 | 14,654 | 26.8% | 26% | 8.6% |
| Q1 2024 | 11,824 | 24.3% | 24% | 8.3% |
| Q2 2024 | 12,771 | 19.5% | 20% | 8.6% |
| Q3 2024 | 14,331 | 18.8% | 19% | 9.0% |
| Q4 2024 | 17,288 | 18.0% | 18% | 9.2% |
| Q1 2025 | 13,921 | 17.7% | 19% | 8.9% |
| Q2 2025 | 15,694 | 22.9% | 22% | 9.4% |
| Q3 2025 | 17,703 | 23.5% | 22% | 9.8% |
| Q4 2025 | 21,317 | 23.3% | 22% | 10.0% |
| Q1 2026 | 17,243 | 23.9% | 22% | 9.5% |
| Q2 2026 | 19,809 | 26.2% | 26% | 9.9% |
| Q3 2026 | 19,637 | 10.9% | 12% | 9.7% |
Source: Driven Metrics analysis of Amazon earnings releases, February 2024 to October 2026. Growth excluding currency is as published by Amazon. Reported growth and share of net sales are our calculations.
Key Findings
- Amazon’s ad revenue rose from $12.06 billion in Q3 2023 to $19.64 billion in Q3 2026, but Q3 2026 came in $172 million below Q2 2026. It was the only Q3 in our data to fall short of the quarter before it.
- Amazon’s growth excluding currency held at 22% for four straight quarters, Q2 2025 through Q1 2026, then jumped to 26% in Q2 2026 and dropped to 12% in Q3 2026. That swing matches Prime Day moving from Q3 in 2025 to Q2 in 2026.
- Advertising was 9.7% of Amazon’s net sales in Q3 2026, up from 8.4% in Q3 2023 (our calculation), so it is a growing slice of a much larger company even in a soft quarter.
Amazon Ad Revenue by Year and Share of Net Sales
In the table below, we total Amazon’s advertising revenue by calendar year for 2023 to 2025, for the first nine months of 2025 and 2026, and for the 12 months ended September 30, 2026.
| Period | Ad revenue ($M) | Growth vs prior-year period | Amazon net sales ($M) | Ad share of net sales |
|---|---|---|---|---|
| 2023 | 46,906 | n/a | 574,785 | 8.2% |
| 2024 | 56,214 | 19.8% | 637,959 | 8.8% |
| 2025 | 68,635 | 22.1% | 716,924 | 9.6% |
| Jan to Sep 2025 | 47,318 | n/a | 503,538 | 9.4% |
| Jan to Sep 2026 | 56,689 | 19.8% | 584,069 | 9.7% |
| 12 months to Sep 30, 2026 | 78,006 | 20.7% | 797,455 | 9.8% |
Source: Driven Metrics analysis of Amazon earnings releases, February 2024 to October 2026. Annual and year-to-date ad revenue are our sums of Amazon’s quarterly figures. All growth and share figures are our calculations.
Key Findings
- Amazon’s advertising revenue was $68.6 billion in calendar 2025, up 22.1% from $56.2 billion in 2024, which had grown 19.8% from $46.9 billion in 2023 (our calculation).
- In the first nine months of 2026, Amazon ad revenue reached $56.7 billion, up 19.8% from $47.3 billion a year earlier. The year-to-date view absorbs the Prime Day shift because Q2 and Q3 both sit inside it.
- Advertising’s share of Amazon net sales rose from 8.2% in 2023 to 9.6% in 2025 and 9.7% in the first nine months of 2026 (our calculation). If you are using Amazon’s ad revenue to size retail media, the 12-month figure of $78.0 billion is the cleanest single number.
Why Amazon Ad Growth Fell to 12% in Q3 2026
Amazon told investors on October 29, 2026 that ad growth in Q3 2026 was “impacted by timing anomalies primarily related to Prime Day (and a couple other timing factors).” Prime Day ran in Q2 for most large countries in 2026, while in 2025 it ran entirely in Q3. Amazon said the shift cut about 400 basis points from its total Q3 net sales growth. It did not give a figure for advertising alone.
In the table below, we combine Q2 and Q3 for 2026 and for 2025, so Prime Day sits in the same six-month window both years, and compare the result with Google’s and Microsoft’s ad lines on the same basis.
| Ad line | Q2 2026 reported growth | Q3 2026 reported growth | Q2+Q3 2026 ($M) | Q2+Q3 2025 ($M) | Combined growth |
|---|---|---|---|---|---|
| Amazon advertising | 26.2% | 10.9% | 39,446 | 33,397 | 18.1% |
| Google Search & other | 16.8% | 12.0% | 126,621 | 110,757 | 14.3% |
| YouTube ads | 12.9% | 9.2% | 22,262 | 20,057 | 11.0% |
| Microsoft search and advertising | 10.9% | 10.3% | 12,989 | 11,744 | 10.6% |
Source: Driven Metrics analysis of Amazon earnings releases (July and October 2026), Alphabet earnings releases (July 22 and October 28, 2026) and Microsoft’s September 2026 restated metrics and Q1 FY2027 Form 10-Q. All growth figures are our calculations.
Note: Microsoft’s quarters are its fiscal Q4 FY2026 (April to June 2026) and Q1 FY2027 (July to September 2026), restated to include LinkedIn Marketing Solutions and Premium Subscriptions.
Key Findings
- Amazon’s ad revenue grew 18.1% across Q2 and Q3 2026 combined ($39.45 billion vs $33.40 billion), compared with 10.9% for Q3 2026 alone (our calculation).
- Google Search & other, YouTube ads and Microsoft search and advertising barely move between the single-quarter and two-quarter views (14.3%, 11.0% and 10.6% combined). Prime Day is an Amazon event, so only Amazon’s number swings.
- If you are reading Amazon’s Q3 2026 ad growth on its own, treat 12% as a timing effect, not a new run rate. The two-quarter figure is the fairer comparison with Google and Microsoft.
Our read on this: the combined 18.1% still sits about five points below the 22.9% to 23.9% reported growth Amazon posted from Q2 2025 through Q1 2026. Some of that gap may be the “couple other timing factors” Amazon mentioned, and some may be real slowing. Q4 2026, with no Prime Day distortion, is the cleaner test.
Q3 2026 Search Ad Scorecard: Amazon vs Google vs Microsoft
In the table below, we compare the three ad lines for the quarter ended September 30, 2026: the revenue each company reported, the headline growth rate it published and the basis behind it, our reported-revenue growth rate, and the dollars each line added year over year.
| Ad line | Q3 2025 ($M) | Q3 2026 ($M) | Headline growth and basis | Reported growth | Dollars added ($M) | Share of dollars added |
|---|---|---|---|---|---|---|
| Google Search & other | 56,567 | 63,350 | 12%, reported | 12.0% | 6,783 | 72.7% |
| Amazon advertising | 17,703 | 19,637 | 12%, excluding currency | 10.9% | 1,934 | 20.7% |
| Microsoft search and advertising | 5,942 | 6,554 | 12%, excluding traffic acquisition costs | 10.3% | 612 | 6.6% |
| Total, three lines | 80,212 | 89,541 | n/a | 11.6% | 9,329 | 100.0% |
Source: Driven Metrics analysis of Alphabet’s Q3 2026 earnings release (October 28, 2026), Amazon’s Q3 2026 earnings release (October 29, 2026), Microsoft’s Q1 FY2027 earnings release and Form 10-Q (October 28, 2026). Headline growth is as published by each company. Reported growth, dollars added and shares are our calculations.
Key Findings
- Google Search & other added $6.78 billion year over year in Q3 2026, 72.7% of the $9.33 billion the three lines added together, while Amazon advertising added $1.93 billion (20.7%) and Microsoft $0.61 billion (6.6%) (our calculation).
- The three 12% headlines use three bases. Google’s 12% is reported growth. Amazon’s 12% excludes currency; on reported revenue it was 10.9%. Microsoft’s 12% excludes traffic acquisition costs, the payments it makes to partner sites, and from this quarter includes LinkedIn advertising and Premium subscriptions; on reported revenue it was 10.3%.
- So if you are comparing platforms, use reported revenue. On that basis Google Search grew fastest in Q3 2026 and Amazon second, but on the Prime Day-neutral view in Table 3, Amazon leads.
For context, Alphabet’s total Google advertising revenue, which adds YouTube ads and Google Network to Search, grew 10.6% in Q3 2026 ($82.01 billion vs $74.18 billion, our calculation). Microsoft’s change of definition matters for anyone tracking Bing: on its old basis Microsoft first reported 10% search advertising growth excluding traffic acquisition costs for April to June 2026, and its restated series now shows 13% for the same quarter. We cover search share in our search engine market share report.
Search Ad Revenue Growth by Quarter, Q3 2025 to Q3 2026
In the table below, we track reported growth for the three ad lines over the five quarters from Q3 2025 to Q3 2026, alongside the growth rates Amazon and Microsoft published on their own adjusted bases.
| Calendar quarter | Amazon reported | Amazon excl. currency (Amazon) | Google Search & other reported | Microsoft reported (restated basis) | Microsoft excl. TAC (Microsoft, restated) |
|---|---|---|---|---|---|
| Q3 2025 | 23.5% | 22% | 14.5% | 15.2% | 16% |
| Q4 2025 | 23.3% | 22% | 16.7% | 10.7% | 13% |
| Q1 2026 | 23.9% | 22% | 19.1% | 11.6% | 14% |
| Q2 2026 | 26.2% | 26% | 16.8% | 10.9% | 13% |
| Q3 2026 | 10.9% | 12% | 12.0% | 10.3% | 12% |
Source: Driven Metrics analysis of Amazon and Alphabet earnings releases (October 2025 to October 2026) and Microsoft’s September 2026 restated metrics, Q1 FY2027 earnings release and Form 10-Q. Reported growth figures are our calculations; adjusted figures are as published.
Note: Microsoft’s calendar Q3 2025 to Q3 2026 are its fiscal Q1 FY2026 to Q1 FY2027.
Key Findings
- Amazon’s reported ad growth ran between 23.3% and 26.2% from Q3 2025 to Q2 2026, ahead of Google Search & other in every one of those four quarters, then fell to 10.9% in Q3 2026, below Google’s 12.0% (our calculation).
- Google Search & other also slowed, from a peak of 19.1% in Q1 2026 to 12.0% in Q3 2026, even though Alphabet said Search query growth in Q3 2026 was the highest in five years.
- Microsoft search and advertising was the steadiest line, between 10.3% and 11.6% reported growth for four straight quarters, which means it now trails both Google and Amazon on a reported basis.
Amazon Ad Revenue Compared With Google Search and YouTube
In the table below, we size Amazon’s advertising business against Google Search & other, YouTube ads and Microsoft search and advertising, for single quarters and for the 12 months ended September 30, 2026.
| Measure | Q3 2025 | Q2 2026 | Q3 2026 | 12 months to Sep 30, 2026 |
|---|---|---|---|---|
| Amazon ad revenue per $1 of Google Search & other | $0.313 | $0.313 | $0.310 | $0.312 |
| Amazon ad revenue as a multiple of YouTube ads | 1.73x | 1.79x | 1.75x | 1.79x |
| Amazon ad revenue as a multiple of Microsoft search and advertising | 2.98x | 3.08x | 3.00x | 3.07x |
Source: Driven Metrics analysis of Amazon, Alphabet and Microsoft earnings releases and filings, October 2025 to October 2026. 12-month totals: Amazon 78,006, Google Search & other 250,093, YouTube ads 43,528, Microsoft 25,447 ($M). All figures are our calculations.
Key Findings
- Amazon earned $0.31 in advertising revenue for every $1 of Google Search & other revenue in Q3 2026 ($19.64 billion vs $63.35 billion), down slightly from $0.313 in Q3 2025 and $0.313 in Q2 2026 (our calculation).
- Amazon’s Q3 2026 ad revenue was 1.75 times YouTube’s $11.21 billion in ad revenue and 3.00 times Microsoft’s $6.55 billion in search and advertising revenue for the same quarter (our calculation).
- Over the 12 months ended September 30, 2026, Amazon’s $78.0 billion in ad revenue equaled $0.31 per $1 of Google Search & other. Amazon is a larger ad business than YouTube and Microsoft’s ad line combined, but still less than a third the size of Google Search.
These are business-size comparisons, not product comparisons. Google Search & other includes ads across Google’s owned properties beyond the results page, and Amazon’s line includes display, video and streaming TV ads, not only sponsored listings in Amazon search. We track AI search ad formats separately in our Google AI Mode ads statistics.
Amazon Advertising Revenue Forecast: Q4 and Full-Year 2026
Amazon said on October 29, 2026: “We expect year-over-year advertising revenue to grow in the high teens in fourth quarter 2026.” In the table below, we turn that guidance into dollar estimates for Q4 2026 and calendar 2026, reading “high teens” as 16% to 19% growth on Q4 2025’s $21.32 billion.
| Scenario | Q4 2026 growth | Q4 2026 ad revenue ($M) | Calendar 2026 ad revenue ($M) | Growth vs 2025 | Dollars added vs 2025 ($M) |
|---|---|---|---|---|---|
| Low (16%) | 16% | 24,728 | 81,417 | 18.6% | 12,782 |
| Midpoint (17.5%) | 17.5% | 25,047 | 81,736 | 19.1% | 13,101 |
| High (19%) | 19% | 25,367 | 82,056 | 19.6% | 13,421 |
Source: Driven Metrics analysis of Amazon’s Q3 2026 earnings release and guidance (October 29, 2026). The 16% to 19% range is our reading of “high teens.” All figures are our calculations.
Note: Amazon did not say whether its Q4 ad guidance excludes currency. Its total Q4 2026 net sales guidance assumes an unfavorable currency impact of about 60 basis points, so reported growth could land slightly below the ex-currency rate.
Key Findings
- If Q4 2026 ad growth lands between 16% and 19%, Amazon’s calendar 2026 advertising revenue will be $81.4 billion to $82.1 billion, with a midpoint of $81.7 billion (our calculation).
- That would be 18.6% to 19.6% growth over 2025’s $68.6 billion, close to 2025’s 22.1% pace, because Amazon already booked $56.7 billion through September (our calculation).
- The Q4 estimate of $24.7 billion to $25.4 billion would make Q4 2026 Amazon’s largest ad quarter on record, above Q4 2025’s $21.3 billion. Watch that number when Amazon reports in early 2027.
What Amazon’s 2026 Ad Numbers Mean for Search Marketers in 2027
The Q3 2026 headline undersells Amazon. Once Prime Day sits in the same window both years, Amazon’s ad business grew faster than Google Search and far faster than Microsoft’s ad line in the middle of 2026. It is on track to pass $80 billion in a calendar year for the first time.
Google still sets the scale. It added $6.78 billion in Search revenue in a single quarter, more than three times Amazon’s increase. Microsoft’s switch to a combined Bing and LinkedIn metric means its growth rate is no longer a clean read on Bing, so treat comparisons across the September 2026 break with care.
So if you are comparing these platforms in a budget deck, use reported revenue for all three, and use the Q2 and Q3 combined view for any 2026 Amazon growth figure.
Data Collection and Methodology
Unit of analysis and sample. One row is one company’s revenue line in one calendar quarter. The dataset has 94 rows: Amazon advertising services revenue and worldwide net sales for 17 quarters (Q3 2022 to Q3 2026) plus one guidance row; five Alphabet lines (Google Search & other, YouTube ads, Google Network, total Google advertising and total traffic acquisition costs) for nine quarters (Q3 2024 to Q3 2026); and Microsoft search and advertising revenue for nine quarters plus growth-rate rows. The article uses 13 Amazon quarters, Q3 2023 to Q3 2026, because reported growth needs the prior-year quarter.
Inclusion rules. We included only figures published by Amazon, Alphabet or Microsoft in earnings releases or SEC filings dated February 1, 2024 to October 29, 2026. We excluded analyst estimates, third-party market estimates and statistics roundups. Meta and other ad platforms are out of scope because the piece covers the three companies whose Q3 2026 search and commerce ad lines were reported at about 12%.
Definitions.
- Amazon advertising revenue: Amazon’s “advertising services” net sales, which Amazon defines as sales of advertising services to sellers, vendors, publishers, authors and others, through sponsored ads, display and video advertising.
- Google Search & other: Alphabet’s revenue line of that name, reported as part of Google advertising.
- Microsoft search and advertising: Microsoft’s product line covering Bing, Microsoft Edge, LinkedIn Marketing Solutions and Premium Subscriptions, third-party affiliates and MSN, as restated in September 2026. Microsoft’s fiscal year ends June 30, so its Q1 FY2027 is calendar Q3 2026.
- Reported growth: growth in dollar revenue as stated, with no currency or traffic acquisition cost adjustment.
- Excluding currency (Amazon) and excluding TAC (Microsoft): adjusted growth rates published by those companies. We report them as published and do not recalculate them.
- Prime Day-neutral growth: growth of Q2 plus Q3 revenue combined, compared with the same two quarters a year earlier.
Formulas.
- Reported y/y growth = quarter revenue ÷ same quarter a year earlier − 1
- Ad share of net sales = advertising revenue ÷ worldwide net sales
- Annual, year-to-date and 12-month totals = sum of the reported quarters
- Prime Day-neutral growth = (Q2 + Q3 2026) ÷ (Q2 + Q3 2025) − 1
- Dollars added = Q3 2026 revenue − Q3 2025 revenue; share of dollars added = a line’s dollars added ÷ the three lines’ combined dollars added
- Amazon ad revenue per $1 of Google Search = Amazon ad revenue ÷ Google Search & other revenue
- Q4 2026 estimate = Q4 2025 ad revenue × (1 + 16%, 17.5% or 19%); calendar 2026 estimate = January to September 2026 ad revenue + Q4 2026 estimate
Collection date, rounding and currency. We captured all figures on November 1, 2026. All revenue is in US dollars as reported, in millions. Growth rates are rounded to one decimal place after calculation from unrounded inputs. Company-published growth rates are whole percentages as published.
Limits of the data
- The three revenue lines measure different businesses. Amazon’s line includes display, video and Prime Video ads; Google Search & other includes more than results-page ads; Microsoft’s line includes LinkedIn advertising and subscriptions.
- Microsoft’s definition changed in September 2026. We use its restated series for every quarter, which does not match the search advertising figures Microsoft first published for those quarters.
- Amazon’s guidance does not state whether “high teens” excludes currency, and “high teens” is not a number. Our 16% to 19% range is an interpretation.
- Amazon did not quantify the Prime Day effect on advertising, only on total net sales. Our two-quarter view removes the shift but not the “other timing factors” Amazon mentioned.
To request the full dataset or a PDF copy of this report, contact Driven Metrics, or download the dataset (CSV).
Further Reading
- Google AI Mode Ads Statistics 2026
- Search Engine Market Share: 2026 Data Report
- AI Search Statistics 2026
- AI Overview Click-Through Rate 2026
About the Author
Emily Connor is the Founder and CEO of Driven Metrics, an SEO and generative engine optimization agency. She built Driven Metrics to help brands get found in Google and in AI answers, and she leads the firm’s research on search, ads and AI visibility. Read more about Driven Metrics.
Sources
- Driven Metrics analysis of Amazon, Alphabet and Microsoft advertising revenue, Q3 2022 to Q3 2026 (94 data rows), conducted November 2026. Dataset: amazon-advertising-revenue-dataset.csv
- Amazon.com, Inc., “Amazon.com Announces Third Quarter Results,” October 29, 2026. https://s2.q4cdn.com/299287126/files/doc_earnings/2026/q3/earnings-result/AMZN-Q3-2026-Earnings-Release.pdf
- Amazon.com, Inc., “Amazon.com Announces Fourth Quarter Results,” Form 8-K Exhibit 99.1, February 5, 2026. https://www.sec.gov/Archives/edgar/data/1018724/000101872426000002/amzn-20251231xex991.htm
- Amazon.com, Inc., “Amazon.com Announces Third Quarter Results,” Form 8-K Exhibit 99.1, October 31, 2024. https://www.sec.gov/Archives/edgar/data/1018724/000101872424000158/amzn-20240930xex991.htm
- Amazon.com, Inc., “Amazon.com Announces Fourth Quarter Results,” Form 8-K Exhibit 99.1, February 1, 2024. https://www.sec.gov/Archives/edgar/data/1018724/000101872424000006/amzn-20231231xex991.htm
- Alphabet Inc., “Alphabet Announces Third Quarter 2026 Results,” October 28, 2026. https://s206.q4cdn.com/479360582/files/doc_financials/2026/q3/2026q3-alphabet-earnings-release.pdf
- Alphabet Inc., “Alphabet Announces Second Quarter 2026 Results,” July 22, 2026. https://s206.q4cdn.com/479360582/files/doc_financials/2026/q2/2026q2-alphabet-earnings-release.pdf
- Alphabet Inc., “Alphabet Announces First Quarter 2026 Results,” Form 8-K Exhibit 99.1, April 29, 2026. https://www.sec.gov/Archives/edgar/data/1652044/000165204426000043/googexhibit991q12026.htm
- Alphabet Inc., “Alphabet Announces Fourth Quarter and Fiscal Year 2025 Results,” Form 8-K Exhibit 99.1, February 4, 2026. https://www.sec.gov/Archives/edgar/data/1652044/000165204426000012/googexhibit991q42025.htm
- Alphabet Inc., “Alphabet Announces Third Quarter 2025 Results,” Form 8-K Exhibit 99.1, October 29, 2025. https://www.sec.gov/Archives/edgar/data/1652044/000165204425000087/googexhibit991q32025.htm
- Microsoft Corp., “Microsoft announces first quarter results,” October 28, 2026. https://news.microsoft.com/source/2026/10/28/microsoft-announces-first-quarter-results-2/
- Microsoft Corp., “FY27 Segments and Investor Metrics,” Form 8-K Exhibit 99.1, September 2026. https://www.sec.gov/Archives/edgar/data/0000789019/000119312526380280/d291965dex991.htm
- Microsoft Corp., Form 10-Q for the quarter ended September 30, 2026, filed October 28, 2026. https://www.sec.gov/Archives/edgar/data/789019/000119312526436133/msft-20260930.htm
- Barry Schwartz, “Bing Ads Revenue Up 12% With Overall Revenue Up 19%,” Search Engine Roundtable, October 28, 2026. https://www.seroundtable.com/microsoft-earnings-q127-42404.html
Driven Metrics research · November 2026
By Emily Connor, Founder and CEO, Driven Metrics · Published November 2026 · Updated November 2026