
Driven Metrics research · October 2026
AI Overviews citations are the source links Google attaches to the AI-generated summaries at the top of its search results. A citation can appear as a link card beside the answer, an inline link on a word or phrase, or a related-article link at the end of the response. On October 15, 2026, Google said it would show inline links higher in AI Overviews and AI Mode and test a new section at the top of some responses that highlights the one or two links needed to finish a task (Google, 2026). This report measures which pages earn those citations and what a citation is worth in clicks.
Driven Metrics built this report by combining 10 published studies, datasets and announcements from eight organizations: Ahrefs, BrightEdge, Surfer, Pew Research Center, Seer Interactive, Google, Search Engine Land and Search Engine Journal. The underlying data was collected between February 2025 and September 2026 and covers more than 5 million AI Overview citations and 2.43 billion organic impressions. We reconciled conflicting estimates, recalculated changes between studies, and cross-referenced click data to produce new metrics. We did not run our own crawl or survey for this report; every input is attributed to its original source.
Our analysis found four things. First, Driven Metrics estimates that about 27% of AI Overviews citations also rank in Google’s organic top 10 in 2026, within a range of 17% to 38%, down from 76.1% in Ahrefs’ July 2025 study. Second, four domains (YouTube, Reddit, Facebook and Google) held 60.3% of the citations earned by the 50 most-cited sources in September 2026. Third, using Seer Interactive’s 2025 data, we calculated that being cited recovers 47% of the organic clicks an AI Overview takes away. Fourth, none of the five link changes Google announced on October 15, 2026 came with click or traffic data.
Key statistics: AI Overviews citations in 2026
- According to a 2026 Driven Metrics analysis of four studies, about 27% of AI Overviews citations also rank in Google’s organic top 10, within a 17% to 38% range.
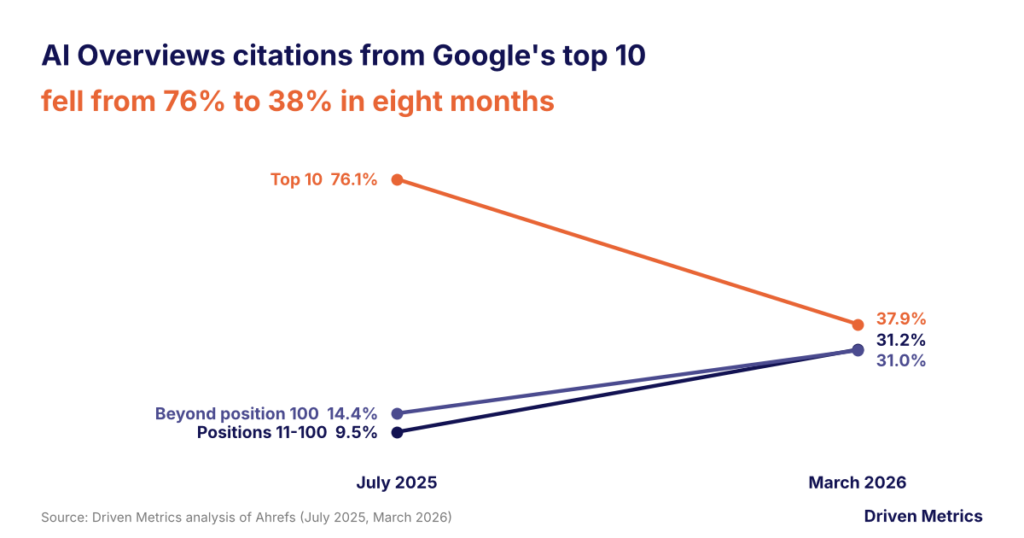
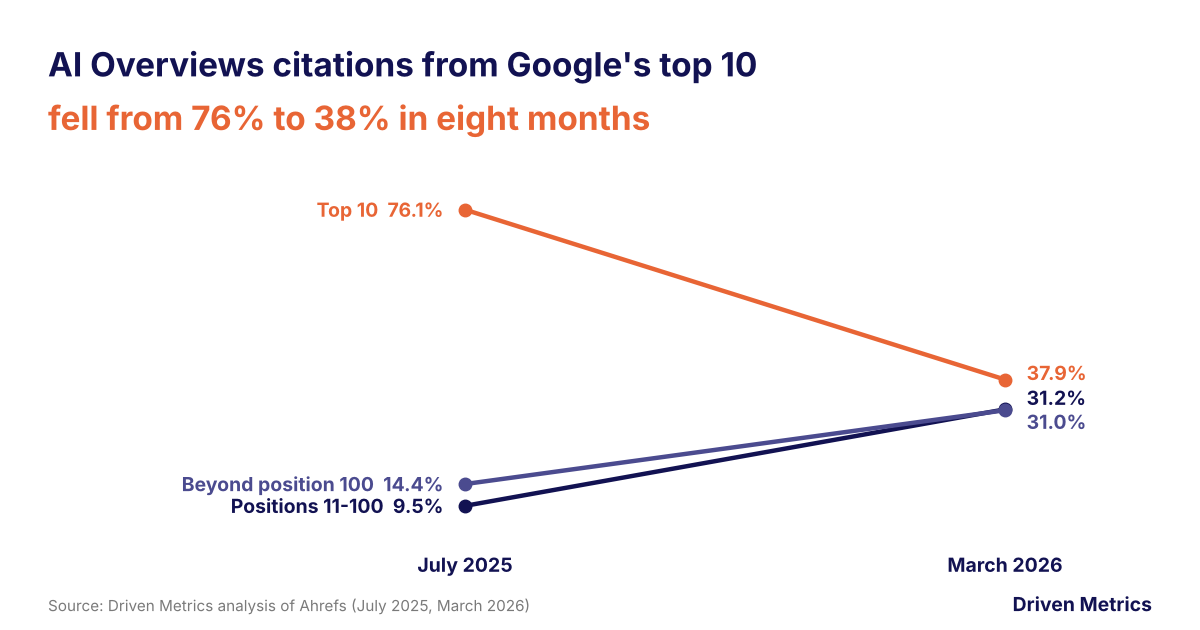
- The share of AI Overview-cited URLs ranking in Google’s top 10 fell from 76.1% in July 2025 to 37.9% in March 2026, a 38.2 percentage point drop calculated by Driven Metrics from two Ahrefs studies.
- BrightEdge found that only about 17% of sources cited in AI Overviews also ranked in the organic top 10 in its February 2026 analysis.
- YouTube earned 22.9% of all citations captured by the top 50 AI Overviews sources in the US in September 2026, according to Ahrefs Brand Radar data.
- Driven Metrics calculated that YouTube, Reddit, Facebook and Google together held 60.3% of top-50 AI Overviews citations in September 2026.
- Brands cited in an AI Overview earned about 20,743 organic clicks per million informational impressions in 2025, versus 9,445 when not cited and 33,500 when no AI Overview appeared (Seer Interactive, 2026).
- A Driven Metrics calculation from Seer Interactive data shows an AI Overviews citation recovers 47% of the organic clicks lost when an AI Overview appears.
- Pew Research Center found that users clicked a link inside a Google AI summary on just 1% of visits to pages with a summary in March 2025.
How often do AI Overviews cite pages ranking in Google’s top 10?
Driven Metrics estimates that about 27% of AI Overviews citations also rank in Google’s organic top 10 for the same query in 2026. That figure is the midpoint of the two most recent large-scale measurements: Ahrefs’ 37.9% (March 2026) and BrightEdge’s roughly 17% (February 2026). Put the other way, about 73% of citations now come from pages that are not on page one for the query the user typed.
Published estimates range from 17% to 76.1%, and the spread is mostly about timing and definitions. Ahrefs’ 2025 and 2026 studies match the same URL in the AI Overview and the results page for the same query; the 2026 study counted every block on the page, including SERP features. BrightEdge tracks overlap with the organic top 10 only. Surfer’s 52% comes from a 405,576-overview dataset whose collection date is not stated on the page.
| Study | Data period | Sample | Top-10 overlap | What it measures |
|---|---|---|---|---|
| Ahrefs | Published Jul 21, 2025 | 1.9M citations, 1M AI Overviews | 76.1% | Top 3 cited URLs per AI Overview vs. same-query rankings |
| Surfer | Not stated (page updated Sep 2026) | 405,576 AI Overviews | 52.0% | Cited sources vs. same-query top 10 organic |
| Ahrefs | Published Mar 2, 2026 | 863K SERPs, 4M cited URLs | 37.9% | Cited URLs in first 10 blocks, incl. SERP features |
| Ahrefs (organic only) | Published Mar 2, 2026 | 863K SERPs, 4M cited URLs | 37.1% | Cited URLs in top 10 blue links only |
| BrightEdge | Feb 2025 to Feb 2026 | BrightEdge tracked keyword set | ~17% | Cited sources vs. organic top 10 |
| Driven Metrics best estimate (DM calculation) | 2026 | Midpoint of 2026 bounds | ~27% (range 17%-38%) | (37.9 + 17.0) / 2 = 27.4 |
Note: studies use different keyword sets and matching rules, so values are not directly comparable. Surfer’s collection date is not published.
The midpoint is a planning number, not a measurement. If your reporting tool matches citations against every element on the results page, expect readings closer to Ahrefs’ 38%. If it compares only against the top 10 blue links, BrightEdge’s 17% is the closer benchmark.
Either way, ranking on page one is no longer the main entry point. Ahrefs and Search Engine Journal both point to Google’s query fan-out process, in which an AI Overview pulls sources from several related sub-queries rather than only the query typed (Search Engine Journal, March 2026).
How has the AI Overviews citation source mix changed since 2025?
Between Ahrefs’ July 2025 and March 2026 studies, the share of AI Overviews citations that rank in Google’s top 10 fell by half, from 76.1% to 37.9%. Driven Metrics calculated that citations from positions 11 to 100 grew 3.3x (9.5% to 31.2%) and citations from pages beyond position 100 grew 2.2x (14.4% to 31.0%).
| Ranking bucket | Jul 2025 (Ahrefs) | Mar 2026, all SERP blocks (Ahrefs) | Mar 2026, organic only (Ahrefs) | Change, pp (DM calculation) | Multiple (DM calculation) |
|---|---|---|---|---|---|
| Top 10 | 76.1% | 37.9% | 37.1% | -38.2 | 0.50x |
| Positions 11-100 | 9.5% | 31.2% | 26.2% | +21.7 | 3.28x |
| Beyond position 100 | 14.4% | 31.0% | 36.7% | +16.6 | 2.15x |
| Total | 100.0% | 100.1% | 100.0% |
Change and multiple compare July 2025 with March 2026 all-SERP-block figures. Totals differ from 100% because of rounding in the source. Source: Ahrefs (July 2025; March 2026).
Ahrefs cautions that the two datasets are not directly comparable, because it improved its citation parsing between studies and can now detect citations it previously missed (Ahrefs, March 2026). Some of the 38.2-point drop may therefore be measurement, not a change in how Google selects sources. The timing still lines up with a real product change: Google made Gemini 3 the model behind AI Overviews in January 2026.
YouTube explains part of the shift beyond the top 100. Ahrefs found that 18.2% of AI Overview-cited pages that did not rank in the top 100 for the same keyword were YouTube URLs, and that YouTube URLs made up 5.6% of all AI Overview citations in its March 2026 dataset.
Which domains get the most AI Overviews citations?
YouTube is the most-cited domain in Google AI Overviews, with 22.9% of the citations earned by the 50 most-cited sources in the US in September 2026 (Ahrefs, 2026). Driven Metrics calculated that the top four domains (YouTube, Reddit, Facebook and Google) held 60.3% of those citations, and that Google-owned properties alone (YouTube and google.com) held 31.7%.
| Rank | Domain | Type | Mention share | Pages cited | Cumulative share (DM calculation) |
|---|---|---|---|---|---|
| 1 | youtube.com | Google-owned video | 22.9% | 1,737,252 | 22.9% |
| 2 | reddit.com | Community forum | 18.5% | 830,641 | 41.4% |
| 3 | facebook.com | Social network | 10.1% | 514,175 | 51.5% |
| 4 | google.com | Google-owned | 8.8% | 1,220,228 | 60.3% |
| 5 | instagram.com | Social network | 5.6% | 277,245 | 65.9% |
| 6 | quora.com | Community Q&A | 4.7% | 171,198 | 70.6% |
| 7 | en.wikipedia.org | Reference | 4.0% | 88,400 | 74.6% |
| 8 | tiktok.com | Social video | 3.3% | 140,750 | 77.9% |
| 9 | amazon.com | Retail | 3.3% | 148,116 | 81.2% |
| 10 | walmart.com | Retail | 1.0% | 47,425 | 82.2% |
| Google-owned (YouTube + google.com) | DM calculation | 31.7% | |||
| Social, video and community platforms (YouTube, Reddit, Facebook, Instagram, Quora, TikTok) | DM calculation | 65.1% |
Mention share is a domain’s citations as a share of the summed citations of the top 50 most-cited domains, not of all AI Overviews citations. Data covers more than 3 million US queries across all topics. Source: Ahrefs Brand Radar, September 2026.
The top 10 domains account for 82.2% of top-50 citations, which leaves the remaining 40 domains in the list with 17.8% between them. Concentration at the top is steep: the 10th-ranked domain, walmart.com, has 1.0%.
Earlier data showed a different mix. Pew Research Center found that Wikipedia, YouTube and Reddit together accounted for 15% of the sources linked in Google AI summaries in March 2025, and that .gov sites made up 6% of AI summary sources versus 2% of standard results (Pew Research Center, 2025). The two datasets use different methods, so the change in ranking order is directional.
Do AI Overviews citations overlap more with rankings in some industries?
Yes. BrightEdge’s February 2026 analysis found top-10 overlap ranged from 24.0% in healthcare to 9.3% in restaurants. Driven Metrics calculated that the unweighted average overlap across the nine industries rose from 13.5% to 18.0% between BrightEdge’s year-apart snapshots, a 4.5 percentage point increase.
| Industry | Top-10 overlap, last year | Top-10 overlap, Feb 2026 | Change, pp (DM calculation) | Not in top 100, Feb 2026 | Positions 11-100, Feb 2026 (DM calculation) |
|---|---|---|---|---|---|
| Healthcare | 23.9% | 24.0% | +0.1 | 22.5% | 53.5% |
| Education | 26.9% | 23.1% | -3.8 | 28.2% | 48.7% |
| B2B Tech | 23.9% | 22.6% | -1.3 | 28.1% | 49.3% |
| Insurance | 22.7% | 22.4% | -0.3 | 28.3% | 49.3% |
| Entertainment | 3.2% | 18.5% | +15.3 | 46.6% | 34.9% |
| Travel | 5.7% | 17.7% | +12.0 | 47.8% | 34.5% |
| eCommerce | 2.9% | 13.4% | +10.5 | 61.5% | 25.1% |
| Finance | 7.6% | 11.3% | +3.7 | 65.7% | 23.0% |
| Restaurants | 5.1% | 9.3% | +4.2 | 76.0% | 14.7% |
| Nine-industry average (DM calculation) | 13.5% | 18.0% | +4.5 | 45.0% | 37.0% |
Positions 11-100 = 100% minus top-10 overlap minus share not in the top 100. Averages are unweighted. BrightEdge reports entertainment’s change as +15.2 pp; our recalculation from its rounded figures gives +15.3 pp. Source: BrightEdge, February 12, 2026.
Regulated, high-trust categories show the tightest link between rankings and citations. Healthcare, education, B2B tech and insurance all sit between 22.4% and 24.0%, and BrightEdge describes healthcare’s overlap as stable year over year.
Entertainment, travel and ecommerce moved the most, up 15.3, 12.0 and 10.5 points. Even so, the majority of citations in finance (65.7%), ecommerce (61.5%) and restaurants (76.0%) came from pages that do not rank anywhere in the top 100. For brands in those categories, AI Overviews visibility and organic rankings behave like separate channels.
Do AI Overviews citations drive clicks?
They do, but they do not make up for the AI Overview itself. Using Seer Interactive’s full-year 2025 data for informational queries, Driven Metrics calculated that being cited lifts organic clicks by 11,298 per million impressions (119.6% more than not being cited), which recovers 47.0% of the 24,055 clicks lost when an AI Overview appears. Cited brands still earned 38.1% fewer clicks than queries with no AI Overview.
| Metric | Value | Source | Driven Metrics calculation |
|---|---|---|---|
| Organic clicks per 1M impressions, no AI Overview | 33,500 | Seer Interactive (informational, 2025) | Baseline |
| Organic clicks per 1M impressions, AI Overview, brand not cited | 9,445 | Seer Interactive | -24,055 vs. baseline |
| Organic clicks per 1M impressions, AI Overview, brand cited | 20,743 | Seer Interactive | +11,298 vs. not cited (119.6%) |
| Share of lost clicks recovered by a citation | 47.0% = 11,298 / 24,055 | ||
| Cited vs. no AI Overview | -38.1% | ||
| Visits with a click on a traditional result, no AI summary | 15% | Pew Research Center (March 2025) | |
| Visits with a click on a traditional result, AI summary shown | 8% | Pew Research Center | |
| Visits with a click on a link inside the AI summary | 1% | Pew Research Center | 8x fewer than traditional links on the same pages |
| All link clicks on pages with an AI summary | 9% (8% + 1%), -40% vs. 15% | ||
| Average click rate per captured summary link | About 0.33% of visits (1% / up to 3 links) | ||
| Visits that ended the browsing session | 26% with summary vs. 16% without | Pew Research Center | +10 pp |
Seer data: 53 brands, 5.47M queries, 2.43B organic impressions, January 2025 to February 2026. Pew data: browsing activity of 900 US adults, March 1-31, 2025; 68,879 Google searches, 12,593 with an AI summary. Pew recorded up to three source URLs per summary, so the per-link rate is an approximation.
Pew’s household panel points the same way at the visit level. Users who saw an AI summary clicked a traditional result on 8% of visits and a summary link on 1%, so total link clicks fell to 9% of visits from 15% on pages without a summary, a 40% drop by our calculation. Because 88% of the summaries Pew studied cited three or more sources, the average cited link received roughly one third of that 1%.
Position inside the overview matters as well. A Search Engine Land analysis of 200-plus AI Overview results pages from February to April 2025 found the first citation in an AI Overview earned roughly the click-through rate of a position 6 organic result, with clicks falling off sharply by the fourth or fifth citation (Search Engine Land, 2025). Surfer’s dataset puts the average at 5 sources per overview, with 8 or fewer in 90% of cases.
Seer notes that its data shows correlation, not causation: brands with more authority are also more likely to be cited. Its 2026 update also found that cited-brand impressions more than doubled from September to October 2025 while clicks held flat, which lowered measured CTR. Seer’s advice for teams reporting on this channel is to track impressions and clicks separately. For ways to earn citations in the first place, see our guide to getting your brand cited in AI answers.
What did Google change in AI Overviews links in October 2026, and did it add clicks?
Google announced five link changes to AI Overviews and AI Mode on October 15, 2026, and published no click or traffic data for any of them. Driven Metrics sorted the changes by the status Google gave them: one launching (inline links shown higher), two in testing (a top-of-response section for one or two key links, and clickable creator names), one starting to roll out (news carousels) and one announced without a timeline (redesigned related links).
| Change | What Google described | Status in Google’s post | Click data published |
|---|---|---|---|
| Inline links shown higher | Links on words or phrases in AI responses; Google says it has made “continued and substantial increases” and will show them higher, more often | Launching | No |
| Top-of-response link section | One or two official links needed to complete a task, with context on why each is useful | Testing | No |
| News carousels | Timely-article carousels expanding to more locations and languages, highlighting Preferred Sources | Starting to roll out | No |
| Related links at end of responses | More prominent links with image thumbnails and a more clickable design | Announced, no timeline given | No |
| Clickable creator names | Creator and publisher names on video results in AI Mode link to Search profiles | Testing (started that week) | No |
| Total (DM count) | 5 changes | 0 of 5 |
Google’s only usage figure in the post: Preferred Sources users grew more than 7x since the start of 2026, with no base number given. Source: Google, October 15, 2026.
Google describes the top-of-response section as an expansion of how it already shows links “front and center” for navigational searches. The open question for publishers is whether moving links higher changes the 1% summary-link click rate Pew measured in 2025, or the citation premium Seer measured.
Until that data exists, the most useful benchmarks are the pre-update ones in this report. For a broader view of AI search usage and zero-click rates, see our AI search statistics report.
Frequently asked questions about AI Overviews citations
Surfer’s analysis of 405,576 AI Overviews found an average of 5 cited sources, with 8 or fewer in 90% of cases. Pew Research Center found that 88% of the AI summaries it studied in March 2025 cited three or more sources and only 1% cited a single source.
No. Driven Metrics estimates that about 27% of AI Overviews citations rank in the organic top 10 in 2026, based on Ahrefs (37.9%) and BrightEdge (about 17%) data. Ahrefs found 31.0% of cited URLs did not rank in the top 100 for the same query in March 2026.
YouTube. It held 22.9% of the citations earned by the 50 most-cited domains in US AI Overviews in September 2026, ahead of Reddit at 18.5%, according to Ahrefs Brand Radar data.
Some. Seer Interactive data shows cited brands earned about 20,743 organic clicks per million informational impressions in 2025, versus 9,445 when not cited. Driven Metrics calculated that this recovers 47% of the clicks an AI Overview removes, but cited brands still trail queries with no AI Overview by 38%.
There is no public data yet. Google announced five link changes on October 15, 2026, including higher inline links and a test section for one or two key links, but published no click or traffic figures with them.
Methodology
Sources combined: Ahrefs (July 2025 and March 2026 citation-ranking studies; September 2026 most-cited domains), BrightEdge (February 2026), Surfer (AI Overviews study, collection date not stated), Pew Research Center (July 2025, data from March 2025), Seer Interactive (April 2026, data January 2025 to February 2026), Search Engine Land (September 2025), Search Engine Journal (March 2026) and Google (October 15, 2026). Data collection spans February 2025 to September 2026.
Formulas: Driven Metrics best estimate = (Ahrefs 2026 top-10 share + BrightEdge 2026 top-10 share) / 2. Percentage point change = later share minus earlier share. Multiple = later share / earlier share. Cumulative domain share = running sum of Ahrefs mention share. Citation recovery = (cited clicks minus not-cited clicks) / (no-AIO clicks minus not-cited clicks). Industry averages are unweighted means across BrightEdge’s nine industries.
Limitations: studies use different keyword sets, markets and matching rules, so cross-study comparisons are directional. Ahrefs changed its parsing method between its 2025 and 2026 studies. Ahrefs mention share is a share of top-50 citations, not of all citations. Seer and Pew measure clicks for different populations (53 brands’ Search Console data and a 900-person US panel). No data in this report measures behavior after Google’s October 15, 2026 changes.
Have AI Overviews citation or click data you would like to contribute to the next edition? Contact Driven Metrics. Teams working on AI Overviews visibility can also see how we approach generative engine optimization.
Sources
- More ways to connect with the web from Search. Google (The Keyword). Hema Budaraju. October 15, 2026. https://blog.google/products-and-platforms/products/search/updates-ai-mode-overviews-explore-web/
- 76% of AI Overview Citations Pull From the Top 10. Ahrefs. Louise Linehan, Xibeijia Guan. July 21, 2025. https://ahrefs.com/blog/search-rankings-ai-citations/
- Update: 38% of AI Overview Citations Pull From The Top 10. Ahrefs. Louise Linehan, Xibeijia Guan. March 2, 2026. https://ahrefs.com/blog/ai-overview-citations-top-10/
- The 50 Most-Cited Websites in Google AI Overviews (September 2026). Ahrefs. Si Quan Ong. Updated September 2, 2026. https://ahrefs.com/blog/most-cited-domains-ai-overviews/
- AI Overviews at the One-Year Mark: Presence, Size, and What They’re Citing. BrightEdge. BrightEdge. February 12, 2026. https://www.brightedge.com/resources/weekly-ai-search-insights/ai-overviews-one-year-presence-size-citing
- Google AI Overviews Study: 25+ Statistics from 405,576 searches. Surfer. Kristavja Caci. Last updated September 17, 2026. https://surferseo.com/blog/ai-overviews-study/
- Google users are less likely to click on links when an AI summary appears in the results. Pew Research Center. Athena Chapekis, Anna Lieb. July 22, 2025. https://www.pewresearch.org/short-reads/2025/07/22/google-users-are-less-likely-to-click-on-links-when-an-ai-summary-appears-in-the-results/
- AIO Impact on Google CTR: 2026 Update. Seer Interactive. Tracy McDonald, Hannah Cooley, Marketa Williams. April 24, 2026. https://www.seerinteractive.com/insights/aio-impact-on-google-ctr-2026-update
- AI Overview citations: Why they don’t drive clicks and what to do. Search Engine Land. Adam Gnuse. September 24, 2025. https://searchengineland.com/ai-overview-citations-clicks-what-to-do-462389
- Google AI Overview Citations From Top-Ranking Pages Drop Sharply. Search Engine Journal. Matt G. Southern. March 2, 2026. https://www.searchenginejournal.com/google-ai-overview-citations-from-top-ranking-pages-drop-sharply/568637/