
Driven Metrics research · November 1, 2026
The AI Overview click through rate is the share of searchers who click an organic result when Google shows an AI-generated summary at the top of the results page. Studies of it disagree, sometimes sharply. In 2026 alone, Ahrefs reported a 58% drop for top-ranking pages while Seer Interactive reported an 85% rebound. Both can be true, because each study measures a different thing over a different window.
For this report, Driven Metrics combined published data from nine studies by seven research teams (Ahrefs, Seer Interactive, Pew Research Center, Amsive, Authoritas, Agarwal and Sen, and Wang et al.) plus Google’s public statements. Two of the studies are randomized field experiments. We put every headline estimate on the same scale, rebuilt Seer’s monthly data to compare it with Ahrefs month for month, and calculated how much of the lost click volume a citation inside the overview wins back. Data covers March 2024 to February 2026, from studies published April 2025 to August 2026.
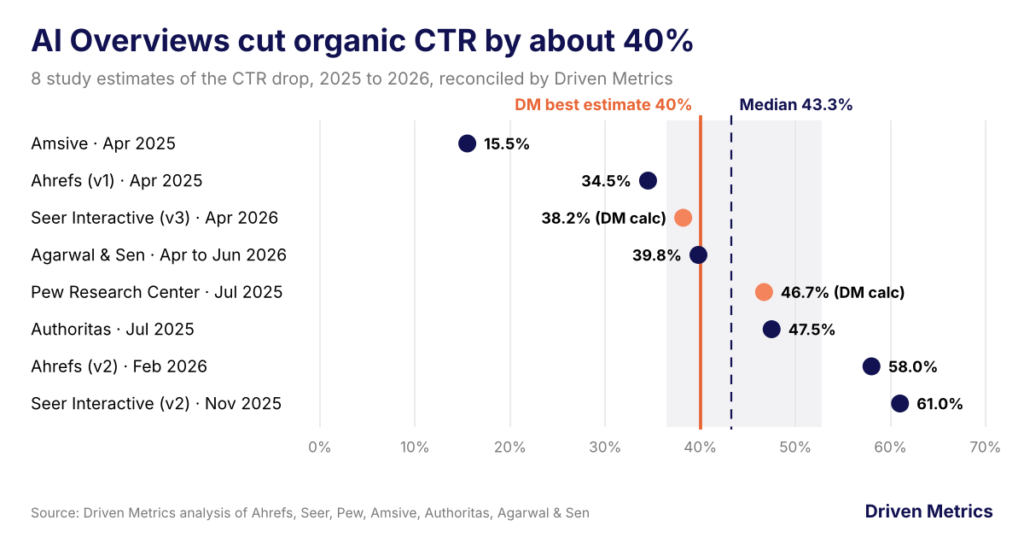
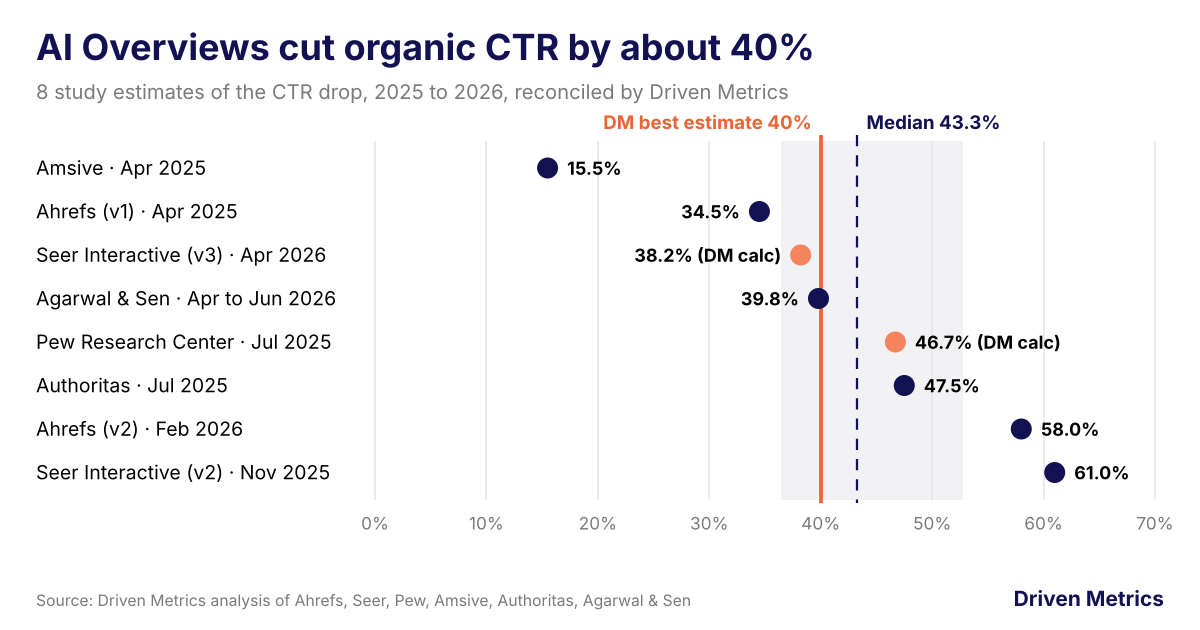
Our analysis found four things. AI Overviews cut organic CTR by about 40% in the typical case, with eight study estimates ranging from 15.5% to 61.0% and a median of 43.3%. The Ahrefs and Seer studies agree more than their headlines suggest: Seer’s own data shows a 58.5% gap in December 2025, the month Ahrefs measured at 58.0%. A citation in the overview wins back 47.0% of the lost clicks, but cited pages still earn 38.1% fewer clicks than pages on queries with no overview. And a single blended CTR hides all of this, which is why we recommend segmenting by AI Overview status instead.
Key Statistics
- According to a 2026 Driven Metrics analysis of eight studies, AI Overviews reduce organic click-through rate by about 40%, with a median estimate of 43.3% and a middle range of 36.4% to 52.8%.
- Ahrefs found that an AI Overview correlated with a 58% lower click-through rate for the top-ranking page in December 2025, up from 34.5% in its March 2025 study.
- Seer Interactive data shows organic CTR on AI Overview queries rose from 1.31% in December 2025 to 2.36% in February 2026, an 80.2% increase by Driven Metrics’ calculation from Seer’s table (Seer reports 85% using rounded figures).
- Driven Metrics calculated a 58.5% gap between AI Overview and non-AI Overview CTR in Seer’s December 2025 data, nearly identical to Ahrefs’ 58.0% for the same month.
- A randomized field experiment of 1,065 desktop Chrome users found AI Overviews cut outbound organic clicks by 39.8% on queries where they appeared (Agarwal and Sen, revised 2026).
- Pew Research Center found Google users clicked a traditional result in 8% of visits when an AI summary appeared, compared with 15% without one, in March 2025 browsing data.
- According to a 2026 Driven Metrics analysis of Seer Interactive data, an AI Overview citation recovers 47.0% of the organic clicks lost when an overview appears.
- Amsive found branded keywords that trigger an AI Overview gained 18.68% in CTR, while keywords with both an AI Overview and a Featured Snippet lost 37.04% (April 2025).
How much do AI Overviews reduce click-through rate?
Driven Metrics estimates that AI Overviews reduce organic click-through rate by about 40% on the queries where they appear. That is our best estimate after putting eight study results on one scale. The estimates run from 15.5% to 61.0%, the median is 43.3%, and the middle half falls between 36.4% and 52.8%.
| Study (published) | Method | Sample and period | Reported CTR drop | DM: comparable drop |
|---|---|---|---|---|
| Amsive (Apr 2025) | Before vs. after AIO, same keywords | 700K keywords on 10 sites; 10K with an AIO | −15.49% | 15.5% |
| Ahrefs v1 (Apr 2025) | Position 1 forecast vs. actual | 300K keywords; Mar 2024 vs. Mar 2025, desktop | −34.5% | 34.5% |
| Seer Interactive v3 (Apr 2026) | AIO vs. no-AIO queries, same month | 5.47M queries, 53 brands; Feb 2026 | 2.36% vs. 3.82% CTR | 38.2% |
| Agarwal & Sen (Apr, rev. Jun 2026) | Randomized field experiment | 1,065 U.S. desktop Chrome users; Jan to Feb 2026 | −39.8% | 39.8% |
| Pew Research Center (Jul 2025) | AIO vs. no-AIO pages, real browsing | 900 U.S. adults; 68,879 searches; Mar 2025 | 8% vs. 15% of visits | 46.7% |
| Authoritas (Jul 2025) | Estimated CTR, UK news queries | 3,500 news terms; Apr 2025, desktop | −47.5% | 47.5% |
| Ahrefs v2 (Feb 2026) | Position 1 forecast vs. actual | 300K keywords; Dec 2023 vs. Dec 2025, desktop | −58.0% | 58.0% |
| Seer Interactive v2 (Nov 2025) | Same AIO queries over time | 3,119 queries, 42 brands; Jun 2024 vs. Sep 2025 | −61.0% | 61.0% |
| Driven Metrics median (8 estimates) | 43.3% | |||
| Driven Metrics middle half (interquartile range) | 36.4% to 52.8% | |||
| Driven Metrics best estimate | Anchored on the randomized study | 40% |
Source: Driven Metrics analysis of the studies listed, 2025 to 2026. DM comparable drop = (CTR without AIO − CTR with AIO) ÷ CTR without AIO where a study reports two CTRs; otherwise the study’s own headline figure. Authoritas mobile result (−37.7%) not included to keep one estimate per study.
We anchored the best estimate on the randomized experiment by Saharsh Agarwal and Ananya Sen because it is the only study here that isolates cause. Their Chrome extension hid AI Overviews for a random group of users, and Search Engine Journal reported that the revised paper found a 39.8% drop in organic clicks when overviews were shown. That figure sits just below the observational median of 43.3%, which is what we would expect: observational studies also pick up other forces that cut clicks, such as more ads and more SERP features.
Two of the eight figures are our own recalculations from published inputs. Pew Research Center reported clicks on 8% of visits with an AI summary and 15% without one in March 2025, which works out to 46.7% fewer clicks. Seer Interactive reported organic CTR of 2.36% on AI Overview queries and 3.82% on other queries in February 2026, a 38.2% gap.
The outliers have clear reasons. Amsive (15.49%) blended branded keywords, which gained clicks, into its average. Seer v2 (61.0%) tracked the same informational queries across 15 months, so it also captured a decline that hit queries without overviews too. Authoritas (47.5%) studied UK news queries and estimated CTR from position models.
Is the AI Overview click-through rate collapsing or recovering?
Both, depending on the month you look at. Driven Metrics rebuilt Seer Interactive’s monthly data and found the gap between AI Overview and non-AI Overview CTR peaked at 58.5% in December 2025. That is the same month Ahrefs measured, and Ahrefs’ figure was 58.0%. Two studies that look like they disagree are describing the same low point.
| Month | Organic CTR, no AIO | Organic CTR, AIO shown | DM: gap (pp) | DM: gap (%) |
|---|---|---|---|---|
| Jan 2025 | 2.75% | 3.19% | -0.44 | -16.0% |
| Feb 2025 | 3.15% | 3.56% | -0.41 | -13.0% |
| Mar 2025 | 3.45% | 3.03% | +0.42 | 12.2% |
| Apr 2025 | 3.44% | 2.76% | +0.68 | 19.8% |
| May 2025 | 3.03% | 2.35% | +0.68 | 22.4% |
| Jun 2025 | 3.07% | 2.06% | +1.01 | 32.9% |
| Jul 2025 | 3.07% | 1.81% | +1.26 | 41.0% |
| Aug 2025 | 2.70% | 1.77% | +0.93 | 34.4% |
| Sep 2025 | 2.99% | 2.14% | +0.85 | 28.4% |
| Oct 2025 | 2.74% | 1.72% | +1.02 | 37.2% |
| Nov 2025 | 2.45% | 1.33% | +1.12 | 45.7% |
| Dec 2025 | 3.16% | 1.31% | +1.85 | 58.5% |
| Jan 2026 | 3.88% | 2.33% | +1.55 | 39.9% |
| Feb 2026 | 3.82% | 2.36% | +1.46 | 38.2% |
| Ahrefs position 1, Dec 2025 (benchmark) | 3.73% forecast | 1.57% | 58.0% |
Source: Seer Interactive, AIO Impact on Google CTR: 2026 Update (Apr 2026), all intents, 53 brands; Ahrefs, Update: AI Overviews Reduce Clicks by 58% (Feb 2026). Gap (pp) = no-AIO CTR − AIO CTR; gap (%) = gap (pp) ÷ no-AIO CTR. Negative values mean AIO queries had the higher CTR. Bold row: December 2025, the month both studies measured.
After December, the picture changed. Seer reported organic CTR on AI Overview queries climbed from 1.31% to 2.36% by February 2026. Seer’s headline calls this an 85% rebound, based on rounded figures of 1.3% and 2.4%; from the two-decimal table we calculate 80.2%. CTR on queries without an overview rose too, from 3.16% to 3.82%, so the gap narrowed to 38.2% rather than closing.
Two caveats keep this from being a clean recovery story. Seer labels a query as AI Overview or not using its most recent SERP snapshot and applies that label to every earlier month, which helps explain why AI Overview queries out-clicked other queries in January and February 2025. Seer also projects only two months of rebound and tells readers not to forecast growth from them. Ahrefs, by contrast, compared December 2023 with December 2025 and stopped there, so it could not see January.
Google’s position sits outside both datasets. Liz Reid, Google’s head of Search, has said the clicks AI Overviews remove are mostly quick bounce clicks and that organic click volume was relatively stable year over year, but Search Engine Journal noted in April 2026 that Google has not published data to support either claim. The randomized study tested this directly and found the extra clicks users made with overviews hidden looked the same on bounce rate, return-to-search and time on site.
How much does an AI Overview citation recover?
According to a 2026 Driven Metrics analysis of Seer Interactive data, being cited in an AI Overview wins back 47.0% of the clicks the overview takes. For every 1 million informational impressions in 2025, queries with no overview earned 33,500 organic clicks, cited brands earned 20,743 and uncited brands earned 9,445.
| Dataset | No AIO | AIO, brand cited | AIO, brand not cited | DM: Citation Recovery Rate |
|---|---|---|---|---|
| Seer v3: clicks per 1M informational impressions, 2025 | 33,500 | 20,743 | 9,445 | 47.0% |
| Seer v3: average organic CTR, informational, full-year 2025 | 3.35% | 2.07% | 0.94% | 46.9% |
| Seer v3: organic CTR, informational, December 2025 | 3.97% | 0.95% | 0.55% | 11.7% |
| Seer v2: organic CTR, informational, Q3 2025 average | 1.45% | 0.70% | 0.52% | 19.4% |
| DM: cited and not cited vs. no AIO (per 1M impressions) | Baseline | -38.1% | -71.8% |
Source: Driven Metrics analysis of Seer Interactive (Nov 2025 and Apr 2026). Citation Recovery Rate = (cited − not cited) ÷ (no AIO − not cited): the share of the clicks lost to an AI Overview that a citation wins back.
We call this the Citation Recovery Rate: (cited clicks − uncited clicks) ÷ (no-overview clicks − uncited clicks). On Seer’s per-million figures that is 11,298 ÷ 24,055, or 47.0%. The full-year CTR averages give almost the same answer (46.9%). A citation is worth roughly half of what an overview takes, but it does not restore the pre-overview baseline: cited pages still earned 38.1% fewer clicks than queries with no overview.
The rate moves a lot over time. It was 19.4% in Seer’s Q3 2025 averages and 11.7% in December 2025, when cited CTR fell to 0.95%. Seer traced part of that Q4 drop to impressions in the cited segment more than doubling while clicks stayed flat, meaning brands were cited on more queries rather than losing clicks on existing ones. Pew’s data points the same direction from the user side: people clicked a link inside the AI summary itself on just 1% of visits in March 2025. For a deeper look at who gets cited, see our AI Overviews citations statistics.
Which queries and positions lose the most clicks?
Top-ranking, non-branded, informational queries lose the most. Ahrefs found the CTR impact of an AI Overview falls from 58.0% at position 1 to 19.4% at position 10 in December 2025, so position 1 loses 3.0 times as much as position 10. Across positions 1 to 10, we calculate a simple average loss of 36.5%.
| Segment | Source and period | CTR change with an AIO | DM note |
|---|---|---|---|
| Position 1 | Ahrefs, Dec 2025 vs. forecast | −58.0% | Largest loss |
| Position 2 | Ahrefs, Dec 2025 vs. forecast | −50.8% | |
| Position 3 | Ahrefs, Dec 2025 vs. forecast | −46.4% | |
| Position 4 | Ahrefs, Dec 2025 vs. forecast | −38.8% | |
| Position 5 | Ahrefs, Dec 2025 vs. forecast | −32.6% | |
| Position 6 | Ahrefs, Dec 2025 vs. forecast | −30.5% | |
| Position 7 | Ahrefs, Dec 2025 vs. forecast | −29.7% | |
| Position 8 | Ahrefs, Dec 2025 vs. forecast | −28.8% | |
| Position 9 | Ahrefs, Dec 2025 vs. forecast | −29.7% | |
| Position 10 | Ahrefs, Dec 2025 vs. forecast | −19.4% | Smallest loss |
| Positions 1 to 10, simple average | Ahrefs, Dec 2025 | −36.5% (DM calc) | |
| Branded keywords | Amsive, 2024 vs. 2025 | +18.68% | Only segment that gained |
| All AIO keywords | Amsive, 2024 vs. 2025 | −15.49% | |
| Non-branded keywords | Amsive, 2024 vs. 2025 | −19.98% | |
| Ranking outside the top 3 | Amsive, 2024 vs. 2025 | −27.04% | |
| AIO plus a Featured Snippet | Amsive, 2024 vs. 2025 | −37.04% | Spread vs. branded: 55.7 pts (DM calc) |
Source: Ahrefs, Update: AI Overviews Reduce Clicks by 58% (Feb 2026); Amsive, Google AI Overviews CTR study (Apr 2025). Ahrefs measures change against a forecast CTR; Amsive measures change against the same keywords’ earlier CTR, so the two scales are not directly comparable.
Amsive’s April 2025 data shows how much the keyword mix matters. Branded keywords that triggered an AI Overview gained 18.68% in CTR, while keywords that also showed a Featured Snippet lost 37.04%, a 55.7-point spread. Amsive also found keywords outside the top 3 lost more (27.04%) than the average, which looks like it contradicts Ahrefs. It does not: Ahrefs measures relative loss against a forecast, and lower positions start from much smaller CTRs.
Exposure varies by intent as well. Seer found AI Overviews on 36% of informational queries, 8% of commercial queries and 5% of transactional queries in its 2026 study, with comparison queries at 95.4% and question-format queries at 85.9%. The randomized study found overviews triggered on 53% of informational queries, 15% of navigational and 6% of transactional, and found click losses concentrated in informational searches.
How do AI Overviews affect paid search CTR?
Paid search held up far better than organic. Driven Metrics calculated from Seer Interactive data that paid CTR on AI Overview queries rose 10.7% between January 2025 and February 2026, from 14.64% to 16.21%, while organic CTR on the same queries fell 26.0%, from 3.19% to 2.36%.
| Series | January 2025 | February 2026 | DM: change (pp) | DM: change (%) |
|---|---|---|---|---|
| Paid, no AIO | 25.98% | 21.85% | -4.13 | -15.9% |
| Paid, AIO shown | 14.64% | 16.21% | +1.57 | +10.7% |
| Organic, no AIO | 2.75% | 3.82% | +1.07 | +38.9% |
| Organic, AIO shown | 3.19% | 2.36% | -0.83 | -26.0% |
Source: Driven Metrics analysis of Seer Interactive, AIO Impact on Google CTR: 2026 Update (Apr 2026), all intents. pp = percentage points.
The no-overview queries moved the opposite way. Paid CTR there fell 15.9% (25.98% to 21.85%) and organic CTR rose 38.9% (2.75% to 3.82%). Seer’s working explanation is a selection effect: as overviews absorb quick-answer searches, the queries left without one skew toward people who intend to click.
Earlier, narrower data looked worse for paid. Seer’s September 2025 update, limited to informational queries, found paid CTR on AI Overview queries fell 68% from June 2024 to September 2025 (19.70% to 6.34%). The difference comes from the query set: the 2026 study added commercial and transactional queries, where advertisers concentrate spend.
What should you measure instead of blended CTR?
Measure CTR separately for three groups of queries: no AI Overview, AI Overview with your brand cited, and AI Overview without your brand cited. Seer’s 2025 data shows why a single number misleads. Over the year, CTR on informational queries with no overview rose 35.5%, cited CTR fell 68.8% and uncited CTR fell 66.7%. A blended CTR averages those three trends into one line that describes none of them.
| Month | No AIO | AIO, brand cited | AIO, brand not cited | DM: cited ÷ not cited |
|---|---|---|---|---|
| Jan 2025 | 2.93% | 3.04% | 1.65% | 1.84x |
| Feb 2025 | 3.23% | 3.57% | 1.81% | 1.97x |
| Mar 2025 | 3.37% | 3.62% | 1.74% | 2.08x |
| Apr 2025 | 3.41% | 3.19% | 1.50% | 2.13x |
| May 2025 | 3.22% | 2.73% | 0.87% | 3.14x |
| Jun 2025 | 3.37% | 2.53% | 0.67% | 3.78x |
| Jul 2025 | 3.40% | 2.78% | 1.24% | 2.24x |
| Aug 2025 | 3.02% | 2.11% | 0.78% | 2.71x |
| Sep 2025 | 3.40% | 2.52% | 0.65% | 3.88x |
| Oct 2025 | 3.54% | 1.21% | 0.67% | 1.81x |
| Nov 2025 | 3.31% | 0.76% | 0.63% | 1.21x |
| Dec 2025 | 3.97% | 0.95% | 0.55% | 1.73x |
| DM: change, Jan to Dec 2025 | +35.5% | -68.8% | -66.7% |
Source: Driven Metrics analysis of Seer Interactive, AIO Impact on Google CTR: 2026 Update (Apr 2026). Seer reports that cited-segment impressions more than doubled from September to October 2025 while clicks held flat, which lowers CTR without lowering clicks.
To turn those segments into a forecast, Driven Metrics built a simple click model using Seer’s per-million benchmarks: expected clicks = impressions × [(1 − AIO share) × 33,500 + AIO share × (citation share × 20,743 + (1 − citation share) × 9,445)] ÷ 1,000,000. With 36% of informational impressions showing an overview (Seer’s 2026 query-level prevalence, used here as an assumption), a site cited on none of those queries would expect 24,840 clicks per million impressions. Cited on half, it would expect 26,874 (+8.2%). Cited on all, 28,907 (+16.4%).
Four measures do most of the work. Track clicks and impressions separately, since Seer’s cited CTR fell in Q4 2025 while clicks held flat. Track your citation rate on queries that show an overview. Track the Citation Recovery Rate against your own no-overview baseline. And keep a list of informational queries Google does not answer with an overview, which earned the highest CTR in Seer’s 2025 data. Google Search Console does not separate AI Overview clicks, as Ahrefs noted in 2025, so AI Overview status has to come from a SERP tracker joined to Search Console data. Citation tracking is the core of generative engine optimization, and the no-overview query list belongs in standard SEO keyword planning. For wider context, see our AI search statistics and zero-click search statistics.
Frequently Asked Questions
In Seer Interactive’s February 2026 data, organic CTR averaged 2.36% on queries with an AI Overview and 3.82% on queries without one. For informational queries across 2025, cited brands averaged 2.07% and uncited brands 0.94%. Your own rate depends on position, brand terms and whether you are cited.
Driven Metrics estimates about 40%, based on eight studies with a median of 43.3%. Estimates range from 15.5% (Amsive, 2025) to 61.0% (Seer, 2025). The only randomized study found 39.8%.
They measure different things in different windows. Ahrefs compared position 1 CTR in December 2023 and December 2025; Seer reported monthly CTR through February 2026. In December 2025 they agree: Seer’s data shows a 58.5% gap and Ahrefs reported 58.0%.
Yes, relative to not being cited. Driven Metrics calculated that a citation wins back 47.0% of the clicks an overview takes, using Seer’s 2025 data. Cited pages still earned 38.1% fewer clicks than queries with no overview.
For some segments. Amsive found branded keywords with an AI Overview gained 18.68% in CTR in 2025, and Seer found paid CTR on AI Overview queries rose from 14.64% to 16.21% between January 2025 and February 2026.
Not directly. Search Console does not separate AI Overview clicks or impressions from other results, so you need a SERP tracker to tag which queries show an overview and whether you are cited, then join that to Search Console data.
Methodology
Driven Metrics combined published data from nine studies by seven research teams, plus Google’s public statements: Ahrefs (April 2025 and February 2026), Seer Interactive (November 2025 and April 2026), Pew Research Center (July 2025), Amsive (April 2025), Authoritas via Press Gazette (July 2025), Agarwal and Sen via Search Engine Journal (revised 2026), Wang et al. (August 2026) and Google statements reported by Search Engine Journal (April 2026). Underlying data covers March 2024 to February 2026. We used each study’s original publication where it was available and did not use statistics roundup pages as sources.
Formulas: comparable drop = (CTR without AIO − CTR with AIO) ÷ CTR without AIO; monthly gap uses the same formula on Seer’s monthly table; Citation Recovery Rate = (cited − not cited) ÷ (no AIO − not cited); percent change = (later ÷ earlier) − 1. The median and interquartile range use the eight estimates in Table 1, one per study edition. Our best estimate of 40% is a judgment: we anchored on the randomized result (39.8%) because the observational median (43.3%) also captures declines unrelated to AI Overviews.
Limitations: the studies use different populations (desktop keywords, U.S. browsing panels, UK news, agency client portfolios), different periods and different definitions of CTR, so the combined figures are directional. Seer applies AI Overview labels retroactively and notes that one account makes up 47% of uncited impressions. The August 2026 experiment by Wang et al. (University of Pennsylvania and Northeastern University) confirms that removing AI features raises click-through rates, but we excluded it from the estimates because we could only verify its abstract.
Have first-party AI Overview CTR data you would share for a future update? Contact Driven Metrics.
Sources
- AI Overviews Reduce Clicks by 34.5%. Ahrefs. Ryan Law, Xibeijia Guan. April 17, 2025. https://ahrefs.com/blog/ai-overviews-reduce-clicks/
- Update: AI Overviews Reduce Clicks by 58%. Ahrefs. Ryan Law, Xibeijia Guan. February 4, 2026. https://ahrefs.com/blog/ai-overviews-reduce-clicks-update/
- AIO Impact on Google CTR: September 2025 Update. Seer Interactive. Tracy McDonald. November 4, 2025. https://www.seerinteractive.com/insights/aio-impact-on-google-ctr-september-2025-update
- AIO Impact on Google CTR: 2026 Update. Seer Interactive. Tracy McDonald, Hannah Cooley, Marketa Williams. April 24, 2026. https://www.seerinteractive.com/insights/aio-impact-on-google-ctr-2026-update
- Google users are less likely to click on links when an AI summary appears in the results. Pew Research Center. Athena Chapekis, Anna Lieb. July 22, 2025. https://www.pewresearch.org/short-reads/2025/07/22/google-users-are-less-likely-to-click-on-links-when-an-ai-summary-appears-in-the-results/
- Google AI Overviews Study Finds Lost Clicks Weren’t Lower Quality (coverage of Agarwal and Sen working paper). Search Engine Journal. Matt G. Southern. July 1, 2026. https://www.searchenginejournal.com/google-ai-overviews-study-finds-lost-clicks-werent-lower-quality/581298/
- Google AI Overviews: New CTR Study Reveals How to Navigate Negative SERP Impact. Amsive. Will Guevara. April 16, 2025. https://www.amsive.com/insights/seo/google-ai-overviews-new-research-reveals-how-to-navigate-click-drop-off/
- AI Overviews cutting publisher clickthrough rates by 50%, new report finds (Authoritas research). Press Gazette. Alice Brooker. July 30, 2025. https://pressgazette.co.uk/media-audience-and-business-data/google-ai-overviews-publishers-report-clickthroughs-authoritas-report/
- Google Pushes “Bounce Clicks” Explanation For AI Overview Traffic Loss. Search Engine Journal. Matt G. Southern. April 25, 2026. https://www.searchenginejournal.com/google-pushes-bounce-clicks-explanation-for-ai-overview-traffic-loss/572986/
- AI in Search Reduces Publisher Referrals Without Improving User Experience: Experimental Evidence. University of Pennsylvania and Northeastern University (alphaXiv / arXiv 2608.18352). Stephanie T. Wang, Jeffrey Gleason, Yakov Bart, Christo Wilson, Danaé Metaxa. August 18, 2026. https://www.alphaxiv.org/abs/2608.18352v1