
Key Findings
- Driven Metrics analyzed 17 top-ranking SEO KPI guides published or updated in 2026, and 13 of them (76.5%) still list total organic traffic as a KPI, as of November 4, 2026 (our calculation, n=17).
- Only 1 of the 17 guides (5.9%) lists revenue per organic visit as a KPI, and 5 (29.4%) list organic revenue or pipeline, as of November 4, 2026 (our calculation).
- Nine of the 17 SEO KPI guides (52.9%) list an AI visibility KPI such as AI mentions, citations or AI share of voice, and 4 (23.5%) list AI referral traffic, as of November 4, 2026 (our calculation).
- In the median 2026 SEO KPI guide, 23.1% of the KPI categories measure business outcomes or AI search; the rest measure rankings, traffic, engagement, links or technical health (our calculation, n=17).
- HubSpot lost about 80% of its organic blog traffic as AI answers spread, its CMO said in October 2026, while its fiscal 2025 revenue grew 19% to $3.13 billion, according to its February 11, 2026 SEC filing.
- Three studies from 2025 and 2026 put the drop in organic click rate when Google shows an AI summary at 38.2% to 58.0%, with a median of 46.7% (our calculation).
On October 29, 2026, Search Engine Journal published an interview with HubSpot CMO Kipp Bodnar. He said HubSpot’s blog, which once drew more than 20 million organic visits a month, lost about 80% of that traffic as AI answers spread, including nearly 5 million visits in one 30-day stretch after Google rolled out AI Overviews. Revenue kept growing anyway. HubSpot now measures revenue per visit, AI share of voice and content-influenced pipeline instead of traffic. So what should the SEO KPIs in 2026 be for companies without HubSpot’s other channels?
To answer that, our analysts built a dataset of 25 SEO KPI guides that rank for “SEO KPIs 2026” and “SEO KPIs to track,” captured on November 4, 2026. Of those, 17 showed a 2026 published or updated date on the page and met our inclusion rules. Together they list 264 KPIs, which we coded into 18 KPI categories. We then compared that advice with primary data on click loss, HubSpot’s SEC filings and five estimates of how AI referral visitors convert. A KPI here is any metric a guide presents as one to track or report; an AI visibility KPI is any measure of how often AI answers name, cite or recommend a brand.
In the following sections, we break down which KPIs the 2026 guides recommend and which ones they put first, measure how much of each guide tracks business outcomes or AI search, lay out the click and HubSpot data that explain why traffic stopped tracking revenue, compare AI referral conversion estimates, and close with a scorecard of the SEO KPIs to track in 2027.
Which SEO KPIs to Track in 2026: What 17 Guides List
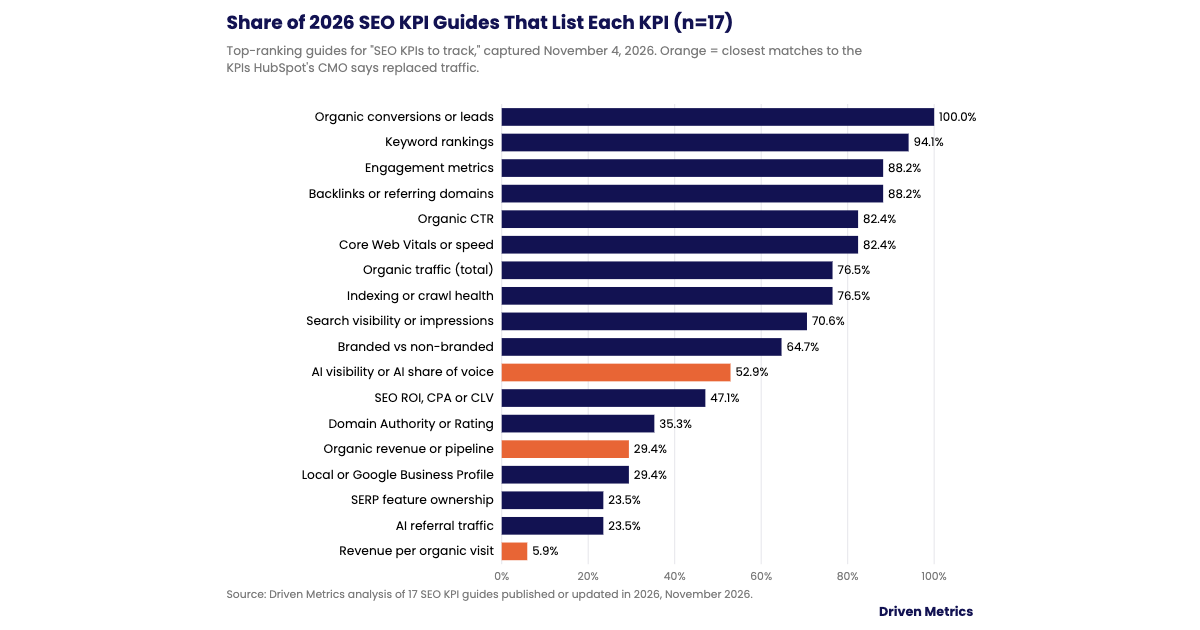
In the table below, we count how many of the 17 guides list each KPI category, how many present it as a core KPI rather than an optional one, and how many tell readers not to use it as a KPI.
| KPI category | Guides listing it | Share of guides | Listed as core KPI | Explicitly rejected |
|---|---|---|---|---|
| Organic conversions, leads or conversion rate | 17 | 100.0% | 17 | 0 |
| Keyword rankings or average position | 16 | 94.1% | 14 | 1 |
| Engagement (bounce rate, time, pages per session) | 15 | 88.2% | 12 | 1 |
| Backlinks or referring domains | 15 | 88.2% | 12 | 0 |
| Organic click-through rate | 14 | 82.4% | 12 | 1 |
| Core Web Vitals or page speed | 14 | 82.4% | 12 | 1 |
| Organic traffic or sessions (total) | 13 | 76.5% | 13 | 2 |
| Indexed pages or crawl health | 13 | 76.5% | 10 | 0 |
| Search visibility, impressions or organic share of voice | 12 | 70.6% | 11 | 0 |
| Branded vs. non-branded traffic or branded search | 11 | 64.7% | 10 | 0 |
| AI visibility, mentions, citations or AI share of voice | 9 | 52.9% | 7 | 0 |
| SEO ROI, CPA/CAC or customer lifetime value | 8 | 47.1% | 7 | 0 |
| Domain Authority or Domain Rating | 6 | 35.3% | 5 | 2 |
| Organic revenue or pipeline | 5 | 29.4% | 5 | 0 |
| Google Business Profile or local metrics | 5 | 29.4% | 4 | 0 |
| SERP feature ownership | 4 | 23.5% | 4 | 0 |
| AI referral (LLM) traffic | 4 | 23.5% | 3 | 0 |
| Revenue per organic visit or session | 1 | 5.9% | 1 | 0 |
Source: Driven Metrics analysis of 17 SEO KPI guides published or updated in 2026, November 2026. All figures are our calculations. “Listing it” includes KPIs a guide marks as optional or supporting. A guide can list several KPIs in one category; each category counts once per guide.
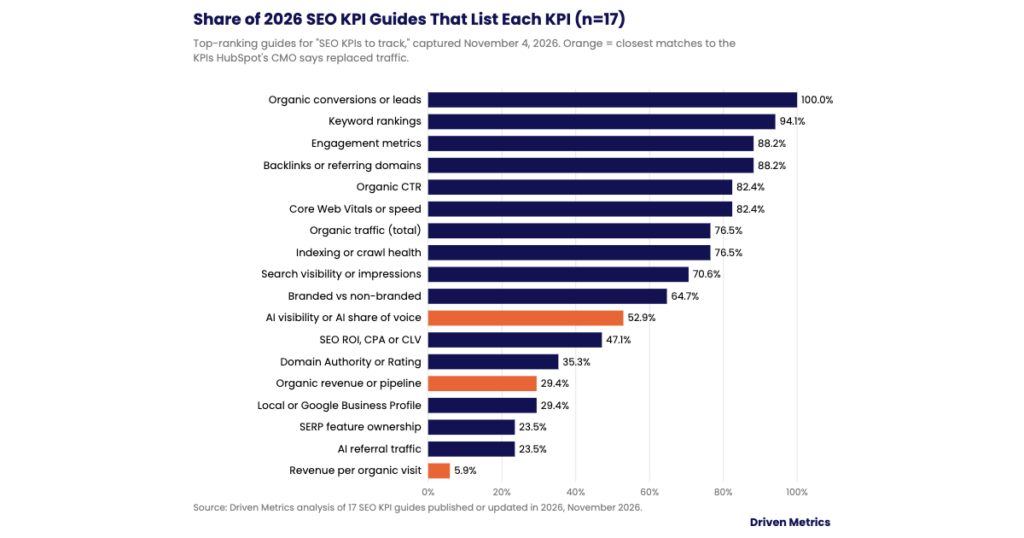
- Every guide (17 of 17) lists organic conversions or leads, and 16 of 17 (94.1%) list keyword rankings, but only 5 (29.4%) list organic revenue or pipeline and 1 (5.9%) lists revenue per organic visit (our calculation).
- The gap comes from how most guides are built: a fixed list of 10 to 20 tool-friendly metrics (rankings, CTR, backlinks, Core Web Vitals) that Google Search Console, GA4 and SEO platforms report by default. Revenue needs a CRM join, which few guides walk through.
- If you report on the default list, you will measure the parts of search that AI answers are shrinking and miss the ones HubSpot says replaced them.
Only 3 of the 17 guides (17.6%) tell readers to stop using any metric as a KPI. Ahrefs rules out 7 of its 14, including organic traffic and keyword rankings, and Ten Speed leaves total organic sessions off the executive dashboard. Vizup says Domain Authority is not worth tracking in 2026.
The 17 SEO KPI Guides We Analyzed
In the table below, we list every guide in the dataset in date order, with how many KPIs it lists, the KPI it puts first, and whether it lists total organic traffic, any AI search KPI, and organic revenue or revenue per visit.
| Guide | Publisher type | Date shown | KPIs listed | First KPI | Total organic traffic | AI KPI | Revenue KPI |
|---|---|---|---|---|---|---|---|
| Ahrefs | SEO software vendor | Updated Jan 9, 2026 | 14 | Search visibility | Rejected | Yes | No |
| Global Media Insight | Agency | Jan 14, 2026 | 22 | Organic conversion rate | Yes | Yes | No |
| Traffic Think Tank | Other | Last updated Jan 19, 2026 | 16 | Organic traffic | Yes | No | No |
| Whatagraph | Other software vendor | Feb 10, 2026 | 11 | Organic traffic | Yes | No | No |
| Ten Speed | Agency | Last updated Mar 16, 2026 | 11 | Organic sign-ups and demos | Rejected | No | Yes |
| Respona | SEO software vendor | Apr 29, 2026 (updated) | 16 | Traffic (organic, referral, branded) | Yes | No | No |
| SEO Sherpa | Agency | Updated May 18, 2026 | 12 | Organic traffic | Yes | Yes | No |
| Vizup | Other | May 22, 2026 | 12 | Organic revenue and pipeline contribution | No | Yes | Yes |
| RankAI | SEO software vendor | Jun 10, 2026 | 30 | Organic impressions | Yes | Yes | Yes |
| Backlinko | Publication | Last updated Jun 19, 2026 | 20 | Organic-assisted conversions | No | Yes | Yes |
| Victorious | Agency | Published Jun 26, 2026 | 16 | Customer lifetime value | Yes | Yes | No |
| 20North | Agency | Jun 26, 2026 | 9 | Organic traffic | Yes | Yes | No |
| Klipfolio | Other software vendor | Updated Aug 29, 2026 | 5 | Visibility and rankings | Yes | No | No |
| Semrush | SEO software vendor | Published Aug 31, 2026 | 18 | Search engine visibility | Yes | Yes | No |
| Techmagnate | Agency | Updated Sep 22, 2026 | 15 | Organic traffic | Yes | No | No |
| Marketing Agency Singapore | Agency | Updated Oct 26, 2026 | 22 | Organic traffic | Yes | No | Yes |
| Analytify | Other software vendor | Updated Nov 1, 2026 | 15 | Organic traffic | Yes | No | No |
Source: Driven Metrics analysis of the guides listed, captured November 4, 2026. Publisher type is based on what each page shows about its publisher. “Rejected” means the guide tells readers not to use the metric as a KPI.
The guides list a median of 15 KPIs each (our calculation), with a range from 5 (Klipfolio) to 30 (RankAI). The table below groups them by what they put first and by publisher type.
| Publisher type | Guides | Lead with a business outcome | List total organic traffic | List an AI KPI |
|---|---|---|---|---|
| Agency | 7 | 3 | 6 | 4 |
| SEO software vendor | 4 | 0 | 3 | 3 |
| Other software vendor | 3 | 0 | 3 | 0 |
| Other | 2 | 1 | 1 | 1 |
| Publication | 1 | 1 | 0 | 1 |
| All guides | 17 | 5 | 13 | 9 |
Source: Driven Metrics analysis of 17 SEO KPI guides, November 2026. All figures are our calculations. First KPI by type across all 17 guides: organic traffic 8 (47.1%), a business outcome 5 (29.4%), visibility or impressions 4 (23.5%).
- Eight of the 17 guides (47.1%) list organic traffic as their first KPI, while 5 (29.4%) lead with a business outcome such as conversions, revenue or customer lifetime value (our calculation).
- SEO software vendors include AI KPIs most often (3 of 4), while none of the 3 analytics and reporting tool vendors (Analytify, Whatagraph and Klipfolio) list an AI KPI. Those tools report what GA4 and Search Console already measure.
- A 2026 date on a guide does not mean 2026 advice. Three of the 17 still reference FID, a Core Web Vitals metric Google replaced with INP in March 2024, and one shows a 2020 publish date in its footer.
How Much of Each SEO KPI Guide Measures Outcomes
In the table below, we measure each guide’s KPI mix: how many of our 18 KPI categories it covers, how many of those measure business outcomes (conversions, revenue, ROI or cost, revenue per visit) or AI search, and the share that leaves.
| Guide | KPI categories covered | Outcome categories | AI categories | Outcome + AI share |
|---|---|---|---|---|
| Ahrefs | 8 | 2 | 2 | 50.0% |
| Backlinko | 11 | 2 | 2 | 36.4% |
| RankAI | 14 | 4 | 1 | 35.7% |
| Semrush | 12 | 2 | 2 | 33.3% |
| Global Media Insight | 14 | 2 | 2 | 28.6% |
| Vizup | 11 | 2 | 1 | 27.3% |
| 20North | 8 | 1 | 1 | 25.0% |
| Victorious | 13 | 2 | 1 | 23.1% |
| Marketing Agency Singapore | 13 | 3 | 0 | 23.1% |
| Ten Speed | 10 | 2 | 0 | 20.0% |
| SEO Sherpa | 11 | 1 | 1 | 18.2% |
| Respona | 11 | 2 | 0 | 18.2% |
| Traffic Think Tank | 12 | 2 | 0 | 16.7% |
| Klipfolio | 7 | 1 | 0 | 14.3% |
| Analytify | 9 | 1 | 0 | 11.1% |
| Whatagraph | 9 | 1 | 0 | 11.1% |
| Techmagnate | 9 | 1 | 0 | 11.1% |
| All 17 guides | 182 | 31 | 13 | 24.2% |
Source: Driven Metrics analysis of 17 SEO KPI guides, November 2026. All figures are our calculations. Outcome + AI share = (outcome categories + AI categories) ÷ KPI categories covered. Rejected metrics are not counted.
- Across all 17 guides, 44 of 182 KPI category slots (24.2%) measure business outcomes or AI search, and the median guide sits at 23.1%, ranging from 11.1% (Analytify, Whatagraph, Techmagnate) to 50.0% (Ahrefs) (our calculation).
- Longer lists do not add more outcome measures. RankAI’s 30 KPIs cover 14 categories, but 9 of those are still visibility, traffic, link and technical metrics.
- When you build your own KPI set, check what share of it a CFO would recognize. In three of every four slots, the 2026 guides measure inputs.
Why Organic Traffic Stopped Tracking Results
In the table below, we compare three studies of how much organic click rate falls when Google shows an AI summary. They use different populations and methods, so we convert each into the same relative drop. For the longer story of why these studies disagree, see our AI Overview click-through rate report.
| Study | Population and method | Period | Click rate with AI summary | Click rate without | Relative drop |
|---|---|---|---|---|---|
| Ahrefs | 300,000 keywords, desktop CTR for the top-ranking page | Dec 2025 vs. Dec 2023 | 0.016 | 0.037 (expected) | 58.0% |
| Pew Research Center | 900 US adults, 68,879 Google searches, browsing panel | Mar 2025 | 8% of visits | 15% of visits | 46.7% |
| Seer Interactive | 53 brands, 5.47M queries, 2.43B organic impressions | Feb 2026 | 2.36% | 3.82% | 38.2% |
Source: Driven Metrics analysis of Ahrefs (Feb 4, 2026), Pew Research Center (Jul 22, 2025) and Seer Interactive (Apr 24, 2026). Pew and Seer drops are our calculations. Relative drop = (rate without − rate with) ÷ rate without. Ahrefs reports its 58% figure directly. Seer’s AI Overview CTR fell 58.9% from January to December 2025 (3.19% to 1.31%) before recovering to 2.36% (our calculation).
- Three 2025 and 2026 studies put the drop in organic click rate on searches with a Google AI summary at 38.2% to 58.0%, with a median of 46.7% (our calculation from Ahrefs, Pew Research Center and Seer Interactive data).
- Fewer clicks per search means sessions can fall while demand, visibility and buyer intent hold steady or grow. Pew also found people ended their browsing session after 26% of searches with an AI summary, vs. 16% without. Our zero-click search statistics cover the wider trend.
- A traffic decline is now a weak signal on its own. Read it next to impressions, AI visibility and conversions before treating it as a loss.
The HubSpot Case: Traffic Down About 80%, Revenue Up 19%
In the table below, we separate what HubSpot disclosed in its SEC filings from what its CMO reported in the October 2026 interview.
| Metric | Value | Period | Status | Source |
|---|---|---|---|---|
| Peak organic blog visits | More than 20 million a month | Before AI answers | Reported | Search Engine Journal |
| Organic blog traffic lost | About 80% | As AI answers spread | Reported | Search Engine Journal |
| Visits lost after AI Overviews rolled out | Nearly 5 million | One 30-day period | Reported | Search Engine Journal |
| Total revenue | $3.13 billion | FY2025 | Disclosed | HubSpot 8-K, Ex. 99.1 |
| Revenue growth | 19% (18% constant currency) | FY2025 vs. FY2024 | Disclosed | HubSpot 8-K, Ex. 99.1 |
| Quarterly revenue | $911.7 million, up 20% | Q2 2026 | Disclosed | HubSpot 8-K, Ex. 99.1 |
| Blog share of content leads | About 10% | 2026 | Reported | Search Engine Journal |
| Qualified leads from AI answers | Up 1,850% | Q1 2025 to Q1 2026 | Reported | Search Engine Journal |
| AI answer leads vs. traditional search leads | Convert at about 3 times the rate | 2026 | Reported | Search Engine Journal |
| Implied change in revenue per organic blog visit | About 6.0x (1.19 ÷ 0.20) | Peak to FY2025 | Our calculation | Driven Metrics |
Source: Driven Metrics analysis of HubSpot SEC Form 8-K filings (Feb 11, 2026 and Aug 5, 2026) and Search Engine Journal (Oct 29, 2026). Disclosed = in an SEC filing. Reported = stated by HubSpot’s CMO in an interview. The implied change divides total revenue growth by organic blog traffic; the two cover different periods and different scopes.
- HubSpot’s fiscal 2025 revenue grew 19% to $3.13 billion (disclosed) while its organic blog traffic fell about 80% from its peak (reported), which implies revenue per organic blog visit rose roughly 6 times (our calculation, illustrative).
- Bodnar said much of the lost traffic came from posts that never sold software, such as how to type the shrug emoji, and that about 90% of HubSpot’s content leads now come from channels other than the blog. The traffic that left was the least valuable traffic.
- Sessions punished HubSpot for losing visits it did not need. Revenue per visit and pipeline showed the business was fine.
We think the 6x figure overstates the lift for most companies, since HubSpot’s growth came from channels it spent five years building. The direction still holds: when traffic and revenue move in opposite directions, traffic is the KPI that broke.
How AI Referral Visitors Convert
In the table below, we compare five estimates of how visitors who arrive from AI tools convert compared with other visitors. Each uses a different comparison group, so we show them as multiples rather than one average. Our AI referral traffic statistics cover volume and platform share.
| Source | Population | Period | Compared with | Result | Multiple | Status |
|---|---|---|---|---|---|---|
| Ahrefs | ahrefs.com signups (one site) | 30 days to Jun 2025 | Traditional organic search | 0.5% of visits drove 12.1% of signups | 23x | Disclosed by company |
| Semrush | Modeled across 500+ SEO and marketing topics | Jul 2025 | Traditional organic search | AI visitor worth 4.4 times as much | 4.4x | Modeled |
| HubSpot via SEJ | HubSpot leads | 2026 | Traditional search | Convert at about 3 times the rate | ~3x | Reported |
| Adobe | 1 trillion+ US retail visits | Nov to Dec 2025 | Other traffic sources | 31% more likely to convert | 1.31x | Disclosed by company |
| Adobe | 1 trillion+ US retail visits | Jul 2025 | Non-AI traffic | 23% less likely to convert | 0.77x | Disclosed by company |
Source: Driven Metrics analysis of Ahrefs (Jun 16, 2025), Semrush (Jul 21, 2025), Search Engine Journal (Oct 29, 2026) and Adobe (Aug 21, 2025 and Jan 12, 2026). Multiple = AI visitor conversion rate or value ÷ the comparison group’s. Adobe’s 1.31x and 0.77x are converted from its percentages (our calculation).
- Five 2025 and 2026 estimates put AI referral visitor conversion at 0.77 to 23 times that of other visitors, with a median of 3 times (our calculation).
- The spread follows the business model. Single-company B2B software data (Ahrefs, HubSpot) shows the largest gaps, while Adobe’s US retail data swung from 23% worse in July 2025 to 31% better in the 2025 holiday season.
- Track AI referral sessions and their conversion rate as their own line in your report. The volume is small, so a blended conversion rate will hide it.
What SEO Teams Report vs. What the Guides Recommend
In the table below, we compare the guide data with two 2025 and 2026 surveys of SEO and marketing practitioners. The surveys use different questions, so read each row on its own.
| Survey | Sample | Fielded | Finding |
|---|---|---|---|
| Search Engine Journal, State of SEO 2026 | 371 SEO professionals, 52 countries | 2025 (published Sep 10, 2025) | 74% name organic traffic as a top measure of SEO success; 60% name qualified leads and sales |
| GoodFirms | 100 marketing and SEO practitioners | Jan to Feb 2026 | 14% track AI and LLM citation visibility, while 89% of brands get cited in AI search results |
Source: Search Engine Journal (Sep 10, 2025) and GoodFirms (Apr 8, 2026). Search Engine Journal does not say whether respondents could choose more than one measure, so the percentages may not sum to 100%.
- 74% of 371 SEO professionals named organic traffic as a top measure of SEO success in Search Engine Journal’s State of SEO 2026 survey, close to the 76.5% of 2026 SEO KPI guides that list total organic traffic (our comparison).
- AI tracking lags on both sides: 52.9% of guides list an AI visibility KPI, and 14% of practitioners in GoodFirms’ January to February 2026 survey track AI citations.
- The guides and the teams that read them still use traffic as the scoreboard, so a traffic drop reads as a failure even when revenue holds.
SEO KPIs to Track in 2027: A Scorecard That Replaces Sessions
In the table below, we list the KPIs we would put on an SEO report for 2027, with the formula, where the data comes from, and how many of the 17 guides list each one today. It follows the three KPIs HubSpot named, plus the inputs that explain them.
| KPI | Formula | Where the data lives | 2026 guides listing it (n=17) |
|---|---|---|---|
| Revenue per organic visit | Organic-attributed revenue ÷ organic sessions | GA4 + CRM | 1 (5.9%) |
| Organic-influenced pipeline | Pipeline value with an organic or AI-referred touch | CRM | 5 (29.4%) |
| Organic conversions by landing page | Key events from organic sessions, per page group | GA4 | 17 (100.0%) |
| AI share of voice | Prompts where AI answers name you ÷ prompts tracked | AI visibility tracker | 9 (52.9%) |
| AI referral sessions and conversion rate | Sessions from AI assistants; their key events ÷ sessions | GA4 | 4 (23.5%) |
| Non-branded organic clicks | Clicks on non-branded queries | Search Console | 11 (64.7%) |
| Search visibility and impressions | Impressions or share of tracked keywords ranking | Search Console + rank tracker | 12 (70.6%) |
Source: Driven Metrics analysis of 17 SEO KPI guides, November 2026. Guide counts are our calculations. Non-branded clicks counts guides that list a branded vs. non-branded split. AI share of voice counts guides that list any AI visibility KPI.
- The three KPIs closest to HubSpot’s replacements for traffic appear in 1, 5 and 9 of the 17 guides (5.9%, 29.4% and 52.9%), while total organic traffic appears in 13 (76.5%) (our calculation).
- Revenue per visit and pipeline put a dollar value on traffic, so they stay readable when sessions fall. AI share of voice and impressions measure demand that never turns into a click.
- Our read: keep sessions in the report as a diagnostic, but take them out of the headline. Lead with revenue per organic visit, pipeline and AI share of voice.
What the 2026 SEO KPI Data Means for 2027
The SEO KPI advice ranking in 2026 still looks like it did before AI answers. Organic traffic, rankings and backlinks sit near the top of most lists, while revenue per visit, pipeline and AI share of voice, the KPIs HubSpot now runs on, show up in a minority of guides. Meanwhile Google AI summaries cut organic click rates by 38.2% to 58.0% in the studies we compared, so sessions will keep falling for many sites that are doing fine.
Three things are worth watching. More guide updates will add AI KPIs, since 9 of 17 already have. HubSpot’s next quarterly results will show whether revenue keeps growing as blog traffic stays low. And AI referral conversion data will firm up as analytics tools separate AI traffic. Our AI search statistics report tracks the usage side.
Data Collection and Methodology
Unit of analysis. One row is one SEO KPI guide: a web page whose main topic is which SEO KPIs or metrics to track.
Sample. On November 4, 2026, we searched “SEO KPIs 2026,” “SEO KPIs to track” and close variants and collected 25 English-language guides from the results. We opened each page and recorded its publisher, title, URL, the date shown on the page, and every KPI in its main list, in order, including ones it marks optional or rules out. 17 guides met the inclusion rules. Together they list 264 KPIs.
Inclusion rules. A guide was included if it (1) presents a list of SEO KPIs or metrics to track, (2) shows a published or updated date between January 1 and November 4, 2026 on the page itself, and (3) loaded in full on the capture date. We excluded 8 guides: 4 showed no date on the page (Search Engine Land, Klipfolio’s KPI examples page, MediaOne and Texta), 1 showed its date only in page metadata (LSEO), 2 were last dated 2023 or 2024 (Shopify and MonsterInsights), and 1 no longer loaded (eesel AI). The excluded guides are listed in the dataset.
Coding. We coded each listed KPI into one of 18 categories (Table 1). A guide counts as listing a category if it presents at least one KPI in it as a KPI to track, including ones marked optional or supporting. “Core” means the guide presents it without that qualifier. “Rejected” means the guide tells readers not to use it as a KPI; rejected metrics do not count as listed. KPIs outside the 18 categories, such as social signals or E-E-A-T, count toward a guide’s KPI total but not toward any category. The first KPI is the first item in the guide’s main numbered or headed list.
Definitions. Organic traffic means total organic sessions, users or clicks; a split into branded and non-branded traffic is coded separately. An AI visibility KPI measures how often AI answers name, cite or recommend a brand. Tracking which keywords trigger an AI Overview, without measuring the brand’s presence in it, is not coded as an AI visibility KPI. Business outcome categories are conversions, revenue or pipeline, ROI or cost, and revenue per visit.
Formulas. Share of guides = guides listing the category ÷ 17. Outcome + AI share = (outcome categories + AI categories) ÷ KPI categories covered by the guide. Relative click drop = (click rate without AI summary − click rate with) ÷ click rate without. Conversion multiple = AI visitor conversion rate or value ÷ the comparison group’s; Adobe’s percentages convert as 1 + 0.31 = 1.31 and 1 − 0.23 = 0.77. HubSpot implied change in revenue per organic blog visit = (1 + 0.19) ÷ (1 − 0.80) = 5.95, rounded to 6.0.
Rounding and firmness. Percentages are rounded to one decimal place. HubSpot revenue figures are disclosed in SEC filings; its traffic, lead and conversion figures are reported by its CMO in an interview. Ahrefs and Adobe figures are disclosed by the companies about their own or their customers’ data; Semrush’s 4.4x figure is modeled. “About” and “more than” figures are used as stated; the 80% traffic loss is treated as an approximate point estimate.
Limits of the data
- The guide sample reflects the search results we saw on November 4, 2026 and is not a random sample of all SEO advice. Rankings change, and personalization may differ by location.
- Coding KPIs into categories involves judgment, especially for combined items such as “Brand mentions and share of voice.” Our coding for each guide is in the dataset.
- Some pages showed a date that conflicts with other dates on the same page (Whatagraph’s footer shows 2020; Ahrefs’ metadata shows a later edit). We used the date shown in the article header.
- The three click studies use different populations, devices and periods, and Pew measures visits rather than impressions.
- The AI referral conversion estimates use different comparison groups, and two come from single companies.
- The HubSpot revenue per visit figure divides company-wide revenue growth by blog-only traffic over different periods, so it is illustrative.
To request the full dataset or a PDF copy of this report, contact Driven Metrics.
Further Reading
- Zero-Click Search Statistics 2026
- AI Overview Click-Through Rate 2026
- AI Referral Traffic Statistics 2026
- AI Search Statistics 2026
About the Author
Emily Connor is the Founder and CEO of Driven Metrics, an SEO and GEO agency. She works with companies on search and AI visibility strategy, reporting and content, and leads Driven Metrics’ research on how AI search is changing the way buyers find businesses.
Sources
- Driven Metrics analysis of 25 SEO KPI guides ranking for “SEO KPIs 2026” and “SEO KPIs to track,” 17 included, captured November 4, 2026, conducted November 2026.
- Search Engine Journal, “HubSpot Lost 80% Of Its Traffic – CMO Kipp Bodnar Explains Why Revenue Kept Growing,” Greg Jarboe, October 29, 2026. https://www.searchenginejournal.com/hubspot-lost-80-of-its-traffic-cmo-kipp-bodnar-explains-why-revenue-kept-growing/594004/
- HubSpot, Inc., “HubSpot Reports Strong Q4 and Full Year 2025 Results,” SEC Form 8-K, Exhibit 99.1, February 11, 2026. https://www.sec.gov/Archives/edgar/data/1404655/000119312526046563/hubs-ex99_1.htm
- HubSpot, Inc., “HubSpot Reports Q2 2026 Results,” SEC Form 8-K, Exhibit 99.1, August 5, 2026. https://www.sec.gov/Archives/edgar/data/0001404655/000119312526335148/hubs-ex99_1.htm
- Pew Research Center, “Google users are less likely to click on links when an AI summary appears in the results,” July 22, 2025. https://www.pewresearch.org/short-reads/2025/07/22/google-users-are-less-likely-to-click-on-links-when-an-ai-summary-appears-in-the-results/
- Ahrefs, “Update: AI Overviews Reduce Clicks by 58%,” Ryan Law, February 4, 2026. https://ahrefs.com/blog/ai-overviews-reduce-clicks-update/
- Seer Interactive, “AIO Impact on Google CTR: 2026 Update,” April 24, 2026. https://seerinteractive.com/insights/aio-impact-on-google-ctr-2026-update
- Ahrefs, “Does AI Search Traffic Convert Better Than Traditional Search? For Ahrefs, Yes: 0.5% of Visitors Drove 12.1% of Signups,” Patrick Stox, June 16, 2025. https://ahrefs.com/blog/ai-search-traffic-conversions-ahrefs/
- Semrush, “We Studied the Impact of AI Search on SEO Traffic. Here’s What We Learned.,” July 21, 2025. https://www.semrush.com/blog/ai-search-seo-traffic-study/
- Adobe, “Generative AI-Powered Shopping Rises with Traffic to U.S. Retail Sites,” August 21, 2025. https://business.adobe.com/blog/generative-ai-powered-shopping-rises-with-traffic-to-retail-sites
- Adobe, “AI-driven traffic surges across industries,” Vivek Pandya, January 12, 2026. https://business.adobe.com/blog/ai-driven-traffic-surges-across-industries
- Search Engine Journal, “The State of SEO 2026: How to Survive,” September 10, 2025. https://www.searchenginejournal.com/the-state-of-seo-2026-how-to-survive/555368/
- GoodFirms, “Only 14% of Marketers Track AI Search Citations,” April 8, 2026. https://www.goodfirms.co/press-releases/marketers-track-ai-search-citations-brands-appearing
- 20North, “How to Measure SEO Performance: The KPIs That Matter,” Jun 26, 2026, accessed November 4, 2026. https://www.20northmarketing.com/blog/seo-kpis-that-matter
- Ahrefs, “14 SEO KPIs You Should And Shouldn’t Track (Updated for AI SEO),” Updated Jan 9, 2026, accessed November 4, 2026. https://ahrefs.com/blog/seo-kpis/
- Analytify, “15 Most Crucial SEO KPIs to Track and Measure Growth in 2026 (Updated List),” Updated Nov 1, 2026, accessed November 4, 2026. https://analytify.io/top-seo-kpis-to-track/
- Backlinko, “The SEO KPIs That Actually Matter (And How to Track Them),” Last updated Jun 19, 2026, accessed November 4, 2026. https://backlinko.com/seo-kpis
- Global Media Insight, “20+ Top SEO KPIs to Track Performance in 2026,” Jan 14, 2026, accessed November 4, 2026. https://www.globalmediainsight.com/blog/top-seo-kpis/
- Klipfolio, “The 5 most important SEO KPIs for digital marketing success,” Updated Aug 29, 2026, accessed November 4, 2026. https://klipfolio.com/blog/most-important-seo-kpis-digital-marketing
- Marketing Agency Singapore, “SEO Metrics: 15 Essential KPIs You Must Track in 2026,” Updated Oct 26, 2026, accessed November 4, 2026. https://marketingagency.sg/seo-metrics-kpis
- RankAI, “SEO KPIs Guide 2026: 31 Metrics to Track and Report,” Jun 10, 2026, accessed November 4, 2026. https://rankai.ai/articles/seo-kpis-guide
- Respona, “16 Vital SEO KPIs to Track in 2026,” Apr 29, 2026 (updated), accessed November 4, 2026. https://respona.com/blog/seo-kpis/
- SEO Sherpa, “SEO KPIs: How to Track and Prove SEO Success in 2026,” Updated May 18, 2026, accessed November 4, 2026. https://seosherpa.com/seo-kpis/
- Semrush, “18 SEO KPIs to measure organic & AI search performance,” Published Aug 31, 2026, accessed November 4, 2026. https://www.semrush.com/blog/seo-kpis
- Techmagnate, “Measure What Matters: 15 SEO KPIs for Digital Growth,” Updated Sep 22, 2026, accessed November 4, 2026. https://www.techmagnate.com/blog/seo-kpis-to-track/
- Ten Speed, “SEO KPIs: 11 Metrics to Measure Success,” Last updated Mar 16, 2026, accessed November 4, 2026. https://www.tenspeed.io/blog/seo-kpis
- Traffic Think Tank, “16 SEO KPIs You Should Be Tracking in 2026,” Last updated Jan 19, 2026, accessed November 4, 2026. https://trafficthinktank.com/seo-kpis/
- Victorious, “16 SEO KPIs To Track in 2026,” Published Jun 26, 2026, accessed November 4, 2026. https://victorious.com/blog/seo-kpis/
- Vizup, “The Definitive Guide to SEO KPIs vs. SEO Metrics: What to Actually Track in 2026,” May 22, 2026, accessed November 4, 2026. https://www.tryvizup.com/blog/seo-kpis-vs-seo-metrics-what-to-track-in-2026
- Whatagraph, “11 Crucial SEO KPIs You Should Be Tracking and Measuring in 2026,” Feb 10, 2026, accessed November 4, 2026. https://whatagraph.com/blog/articles/search-kpi
Driven Metrics research · November 2026
By Emily Connor, Founder and CEO, Driven Metrics · Published November 2026 · Updated November 2026