
Key Findings
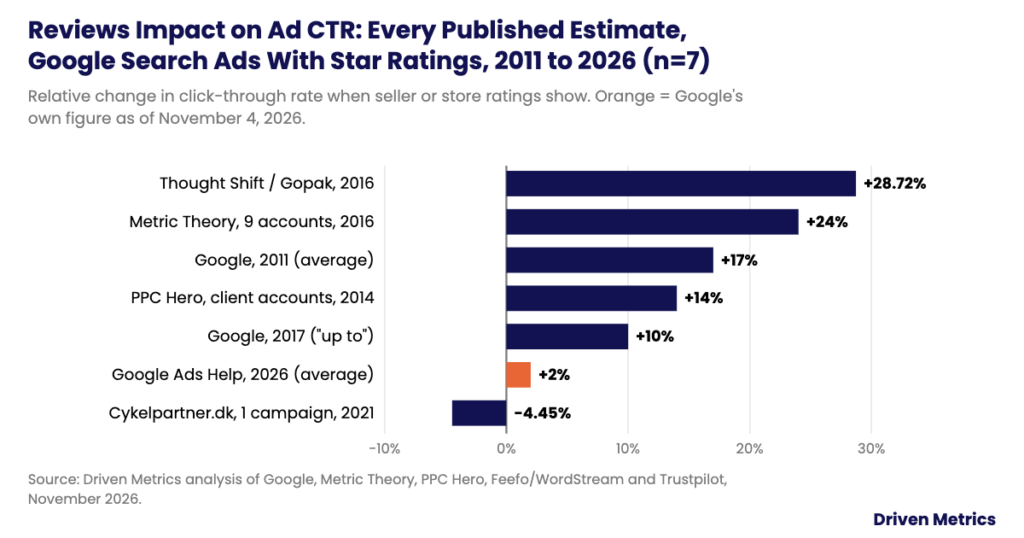
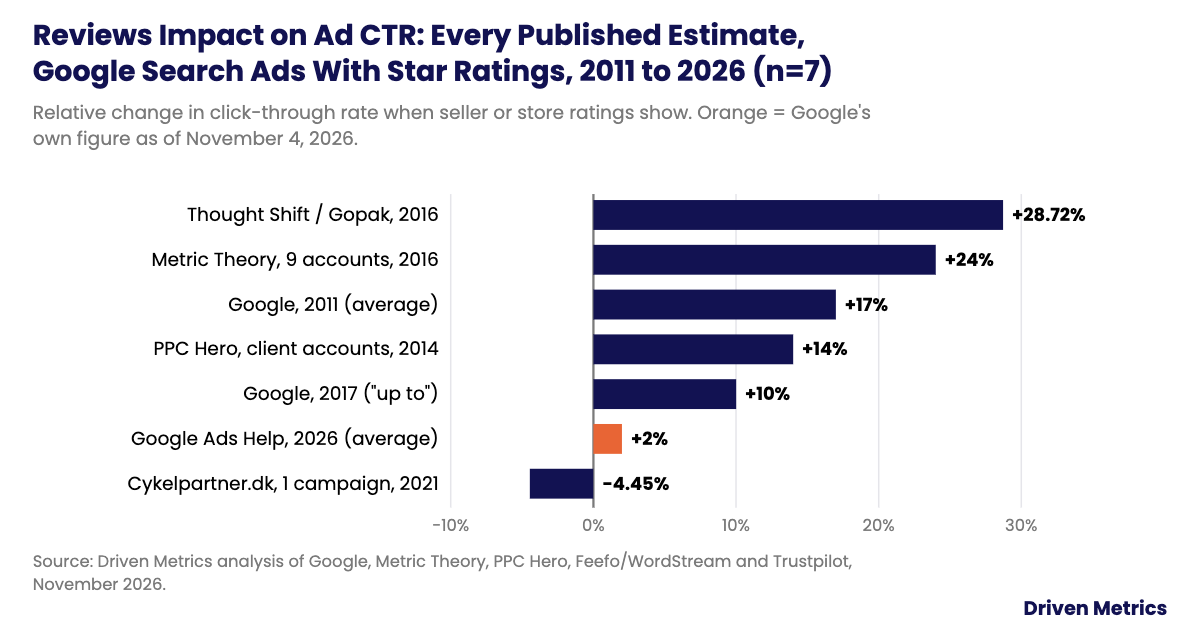
- Driven Metrics compiled every published estimate of the reviews impact on ad CTR for Google Search ads from 2011 to 2026, and Google’s own figure fell from a 17% average lift in 2011 to a 2% average on its store ratings help page as of November 4, 2026, an 88.2% drop (our calculation).
- Four advertiser and agency studies published from 2014 to 2021 measured CTR changes from -4.45% to +28.72% when star ratings showed on Google ads, with a median of +19.0% (our calculation, n=4).
- At the 2026 all-industry median search ad CTR of 6.64%, Google’s 2% lift adds about 1.3 clicks per 1,000 impressions, while the 19% independent median adds about 12.6 (our calculation).
- In a BrightLocal test of 6,283 North American consumers fielded in October and November 2016, a 5-star Google Local Pack listing drew 69% of clicks vs. an implied 41% with no rating, a 68.3% relative lift (our calculation).
- Google’s AI review summaries for Search ads, documented in its Ads Help Center by October 24, 2026, are positive only, cannot be edited by advertisers, run in English in the US, UK, Australia and India, and came with no published CTR data.
- In a UC San Diego study presented in December 2025, 84% of participants who read an AI-generated review summary said they would buy the product, vs. 52% of those who read the original reviews (n=70).
On October 24, 2026, PPC News Feed reported a new Google Ads help page, About Review summaries. It confirms that Google’s AI now pulls reviews from across the web and writes short, positive-only summaries into Search ads, according to PPC Land’s coverage of the page. Advertisers can’t edit the text, and Google shows it only when it predicts the ad will perform better. That puts an old question back in front of every PPC manager: what is the reviews impact on ad CTR, and how much of it should you expect in your account?
To answer it, our analysts compiled 14 published estimates of how review stars change click-through rate on Google search results, from 9 publications dated 2011 to November 2026: 7 for Google Search ads (3 from Google and 4 from advertisers and agencies), 5 for Google’s Local Pack and organic results from BrightLocal, and 2 for organic results from Speero. We added Google’s store rating requirements over time, WordStream by LocaliQ’s 2026 click-through rates for 23 industries, the first study of how people respond to AI review summaries, and Google’s documentation of the new feature. In this report, “CTR lift” means the relative change in click-through rate when ratings show, not a change in percentage points.
In the following sections, we compare every published estimate of the reviews impact on ad CTR, track how Google’s own figure and rating requirements changed since 2011, break down Local Pack and organic results by star rating, look at conversion and cost effects, translate the lift into extra clicks for 23 industries, lay out what Google has documented about AI review summaries, and show how to measure CTR before and after they appear.
How Much Do Reviews Increase Ad CTR? Every Published Estimate
In the table below, we list every published estimate we found of the CTR change on Google Search ads when seller or store ratings show, sorted from highest to lowest.
| Publisher | Published | Rating feature | Method | Sample | CTR change | Status |
|---|---|---|---|---|---|---|
| Thought Shift, reported by Feefo on WordStream | Feb 9, 2016 | Seller ratings | Gopak.co.uk ads with vs. without stars, 5 months of data | 1 advertiser | +28.72% | Reported |
| Metric Theory | Aug 18, 2016 | Seller ratings | Ads with vs. without ratings, same period; non-brand, Google top ads only | 9 ecommerce accounts | +24% | Disclosed by agency |
| Google, Inside AdWords blog | 2011 | Seller rating extensions | Same ads with vs. without ratings, Google data | Not stated | +17% | Disclosed by Google |
| PPC Hero | Jun 24, 2014 | Seller ratings | CTR before vs. after ratings became eligible | “A few” client accounts | +14% | Disclosed by agency |
| Google, The Keyword blog | Apr 3, 2017 | Seller ratings | Not stated | Not stated | Up to +10% | Disclosed by Google |
| Google Ads Help, About store ratings | Undated, accessed Nov 4, 2026 | Store ratings on text ads | Google internal data, Search Network | Not stated | +2% | Disclosed by Google |
| Trustpilot, Cykelpartner.dk case | May 28, 2021 | Seller ratings | Ads with vs. without ratings in one campaign | 1 campaign | -4.45% | Disclosed by advertiser |
Source: Driven Metrics analysis of Google, Metric Theory, PPC Hero, Feefo/WordStream and Trustpilot, November 2026. “Disclosed” = published by the company that owns the data. “Reported” = published by a third party. Google’s 2017 figure is a ceiling (“up to”), not an average.
- The four advertiser and agency studies found CTR changes from -4.45% to +28.72% when star ratings showed, with a median of +19.0% and a mean of +15.6% (our calculation, n=4). Google’s own figure as of November 4, 2026 is a 2% average lift, about one-tenth of the independent median (our calculation).
- We think the gap is mostly about who gets measured. The independent studies are agency case studies of ecommerce accounts that chose to publish, and three of four compare ads with and without ratings in the same account. Google’s 2% is an average across its whole Search network, where ratings now show on far more ads, so the stars stand out less.
- Plan around the low end. Treat 2% as the floor Google stands behind and the 14% to 24% agency range as what a well-rated advertiser in a less crowded auction might see.
The one negative result is worth reading. In the Cykelpartner.dk campaign Trustpilot published in May 2021, CTR fell 4.45% on ads with ratings, but conversion rate rose 34.66% and cost per acquisition fell 20.51%. Stars can filter clicks as well as add them.
Google’s Own Star Rating CTR Figure, 2011 to 2026
In the table below, we track what Google has said star ratings do to ad CTR, next to the review requirements Google set at each point.
| Source | Date | Stated CTR lift | Minimum reviews | Minimum rating | Review window |
|---|---|---|---|---|---|
| Google, Inside AdWords blog | 2011 | 17% average | 30 | 4.0 stars | Not stated |
| PPC Hero, describing Google’s rules | Jun 2014 | Not stated | 30 unique | 3.5 stars | 12 months |
| Metric Theory, describing Google’s rules | Aug 2016 | Not stated | 30 unique | 3.5 stars | 12 months |
| Google, The Keyword blog | Apr 2017 | Up to 10% | Not stated | Not stated | Not stated |
| Google Ads Help, About store ratings | Accessed Nov 4, 2026 | 2% average | 100+ per country for most merchants | 3.5 stars (text ads) | 24 months |
Source: Driven Metrics analysis of Google Inside AdWords (2011), PPC Hero (Jun 24, 2014), Metric Theory (Aug 18, 2016), Google (Apr 3, 2017) and Google Ads Help, About store ratings (accessed November 4, 2026). The 2026 review count is Google’s guidance for most merchants; Google says the number varies by business.
- Google’s stated CTR lift for ads with star ratings fell from a 17% average in 2011 to “up to 10%” in April 2017 and a 2% average on its help page as of November 4, 2026, a decline of 88.2% (our calculation).
- Over the same stretch, the bar to earn stars went up. Google asked for 30 reviews in 2011 and most merchants need about 100 per country in 2026, 3.3 times as many (our calculation), and the review window widened from 12 to 24 months.
- If you budget off a vendor deck that still quotes 10% or 17%, you are using a number Google itself has dropped.
Star Rating Impact on CTR in the Local Pack and Organic Results
In the table below, we break down click share by star rating in two tests of unpaid results: BrightLocal’s 2016 test of the Google Local Pack and localized organic results, and Speero’s 2017 test of organic review stars.
| Study | Surface | Rating shown | Share of clicks | Change vs. no rating (points) | Relative change vs. no rating |
|---|---|---|---|---|---|
| BrightLocal | Google Local Pack | No rating | 41% (implied) | Baseline | Baseline |
| BrightLocal | Google Local Pack | 1 star | 30% (implied) | -11 | -26.8% |
| BrightLocal | Google Local Pack | 3 stars | 44% | +3 | +7.3% |
| BrightLocal | Google Local Pack | 4 stars | 59% | +18 | +43.9% |
| BrightLocal | Google Local Pack | 5 stars | 69% | +28 | +68.3% |
| BrightLocal | Localized organic | No rating | 12% (implied) | Baseline | Baseline |
| BrightLocal | Localized organic | 3 stars | 11% | -1 | -8.3% |
| BrightLocal | Localized organic | 4 stars | 16% | +4 | +33.3% |
| BrightLocal | Localized organic | 5 stars | 19% | +7 | +58.3% |
| Speero (CXL Institute) | Organic, Western market | Review stars shown | Not published | Not published | +35% |
| Speero (CXL Institute) | Organic, European market | Review stars shown | Not published | Not published | +13% |
Source: Driven Metrics analysis of BrightLocal (Apr 25, 2017; fielded Oct to Nov 2016) and Speero (Oct 26, 2017), November 2026. BrightLocal reports the share of clicks for 3, 4 and 5 stars and the point difference vs. no rating; the no-rating and 1-star shares are implied (69 – 28 = 41; 19 – 7 = 12; 41 – 11 = 30). Relative changes are our calculations. Both tests used mock search pages, not live results.
- In BrightLocal’s 2016 test, a 5-star Google Local Pack listing drew 69% of clicks vs. an implied 41% with no rating (+68.3% relative), and a 1-star listing drew an implied 30% (-26.8%) (our calculation, n=6,283).
- Rating level matters more than having stars at all. Three stars barely beat no stars in the Local Pack (+3 points) and lost to no stars in organic results (-1 point). BrightLocal reported that 56% of participants who picked a Local Pack result chose it for its positive ratings.
- Local and organic tests are not ad tests, but they show the same pattern ad studies do: a 4- or 5-star score is what moves clicks, and a weak score costs you.
BrightLocal’s study is from 2016 and Speero’s from 2017. We found no newer controlled test of star ratings on Google search pages published through November 4, 2026.
What Review Stars Do to Conversion Rate and Cost
In the table below, we pull the conversion and cost results from the same ad studies, and combine CTR and conversion rate into the change in conversions per impression where both come from the same population.
| Study | Published | CTR change | Conversion rate change | Other cost effect | Change in conversions per impression |
|---|---|---|---|---|---|
| Metric Theory | Aug 18, 2016 | +24% | +26% | Not reported | +56.2% (our calculation) |
| Trustpilot, Cykelpartner.dk | May 28, 2021 | -4.45% | +34.66% | CPC +7.04%; CPA -20.51% on ads with ratings | +28.7% (our calculation) |
| PPC Hero | Jun 24, 2014 | +14% (average across clients) | +25% (one ecommerce client) | Conversions +50% (same client) | Not calculated: different populations |
Source: Driven Metrics analysis of Metric Theory, Trustpilot and PPC Hero, November 2026. Change in conversions per impression = (1 + CTR change) x (1 + conversion rate change) – 1.
- Ads with star ratings converted 26% to 34.66% better in two advertiser studies from 2016 and 2021, so conversions per impression rose 28.7% to 56.2% even where CTR fell (our calculation).
- Stars do two jobs. They pull more clicks, and they pre-qualify the people who click, which is why Cykelpartner’s CPA dropped while its CTR and CPC moved the wrong way.
- Judge review assets on cost per acquisition, not CTR alone. Google’s own pitch for AI review summaries is “click quality,” which points the same way.
Extra Clicks From Review Stars by Industry, 2026
In the table below, we turn the CTR lift into extra clicks per 1,000 impressions for 23 industries, using WordStream by LocaliQ’s 2026 median search CTRs. We show three cases: Google’s 2% figure, Google’s 2017 “up to 10%” ceiling, and the 19% independent median.
| Industry | Median search CTR, 2026 | Extra clicks at 2% lift | Extra clicks at 10% lift | Extra clicks at 19% lift |
|---|---|---|---|---|
| Arts & Entertainment | 12.75% | 2.6 | 12.8 | 24.2 |
| Finance & Insurance | 9.83% | 2.0 | 9.8 | 18.7 |
| Travel | 9.32% | 1.9 | 9.3 | 17.7 |
| Sports & Recreation | 8.75% | 1.8 | 8.8 | 16.6 |
| Automotive: For Sale | 8.28% | 1.7 | 8.3 | 15.7 |
| Shopping, Collectibles & Gifts | 8.28% | 1.7 | 8.3 | 15.7 |
| Real Estate | 7.61% | 1.5 | 7.6 | 14.5 |
| Education & Instruction | 7.56% | 1.5 | 7.6 | 14.4 |
| Animals & Pets | 7.49% | 1.5 | 7.5 | 14.2 |
| Personal Services | 7.16% | 1.4 | 7.2 | 13.6 |
| Restaurants & Food | 6.83% | 1.4 | 6.8 | 13.0 |
| Beauty & Personal Care | 6.75% | 1.4 | 6.8 | 12.8 |
| Apparel / Fashion & Jewelry | 6.64% | 1.3 | 6.6 | 12.6 |
| Physicians & Surgeons | 6.61% | 1.3 | 6.6 | 12.6 |
| Furniture | 6.57% | 1.3 | 6.6 | 12.5 |
| Industrial & Commercial | 6.57% | 1.3 | 6.6 | 12.5 |
| Home & Home Improvement | 6.47% | 1.3 | 6.5 | 12.3 |
| Business Services | 6.10% | 1.2 | 6.1 | 11.6 |
| Career & Employment | 5.88% | 1.2 | 5.9 | 11.2 |
| Attorneys & Legal Services | 5.87% | 1.2 | 5.9 | 11.2 |
| Health & Fitness | 5.81% | 1.2 | 5.8 | 11.0 |
| Dentists & Dental Services | 5.66% | 1.1 | 5.7 | 10.8 |
| Automotive: Repair, Service & Parts | 5.56% | 1.1 | 5.6 | 10.6 |
| All industries | 6.64% | 1.3 | 6.6 | 12.6 |
Source: Driven Metrics analysis of WordStream by LocaliQ 2026 Google Ads benchmarks (13,474 US Google and Microsoft Ads search campaigns, Apr 1, 2025 to Mar 31, 2026; figures are medians) and the estimates in Table 1, November 2026. All extra-click figures are our calculations. Extra clicks per 1,000 impressions = median CTR x 1,000 x lift.
- At Google’s 2% figure, review stars add 1.1 to 2.6 clicks per 1,000 search ad impressions across 23 industries in 2026; at the 19% independent median, they add 10.6 to 24.2 (our calculation).
- Higher-CTR industries gain the most in absolute clicks. Arts and entertainment (12.75% median CTR), finance and insurance (9.83%) and travel (9.32%) lead, while automotive repair (5.56%) and dentists (5.66%) gain the least.
- For a high-CPC category, run the math in dollars. In our Google Ads cost per lead report, legal and home services have the highest click prices, so a small CTR gain there is worth more per click than the same gain in restaurants.
Google AI Review Summaries in Search Ads: What Is Documented
In the table below, we list what Google’s help page says about AI review summaries, as reported by PPC Land on October 25, 2026, and what it leaves out.
| Item | What the help page says |
|---|---|
| What it is | AI-powered summaries of online reviews that appear directly as part of Search ads |
| Review sources | Reviews “from across the web”; sites are not named |
| Tone | Positive only |
| Advertiser control | Advertisers cannot edit or customize the text |
| When it shows | Only when Google predicts it will improve ad performance; the metric is not named |
| Campaigns and placement | Search campaigns; all ad positions on Google.com; all supported devices |
| Markets | US, UK, Australia and India, in English |
| Verticals | All except sensitive categories, with pharmaceuticals named as the example |
| Opt-out | Not documented |
| Minimum reviews | Not documented |
| Reporting column | Not documented |
| Published CTR or conversion data | None |
Source: Driven Metrics analysis of PPC Land (Luis Rijo, Oct 25, 2026), which quotes Google’s undated help page, About Review summaries.
In the table below, we date each step from the first sighting of review text in Search ads to the help page.
| Date | Event |
|---|---|
| Dec 3, 2025 | Review excerpts spotted in Search ads, mostly on ecommerce ads, reported by PPC News Feed |
| Jul 3, 2026 | AI-generated summaries appear below ad descriptions with a “can make mistakes” disclaimer |
| Aug 2026 | A “What people are saying” label is tested |
| Sep 5, 2026 | A “What customers love” review summary test is reported |
| Oct 24, 2026 | PPC News Feed reports the About Review summaries help page |
Source: Driven Metrics analysis of PPC Land (Oct 25, 2026) and PPC Land’s review summaries explainer (Oct 25, 2026), November 2026.
- Google tested review text in Search ads for 325 days, from December 3, 2025 to October 24, 2026, before documenting the feature, and published no CTR or conversion data with it (our calculation).
- Because summaries show only when Google predicts a lift, any account will see them mostly on auctions where they help. That makes a simple before-and-after comparison look better than the true effect.
- You can’t edit the text, so the inputs are what you control: the reviews themselves, on the sites Google reads.
How AI Review Summaries Could Change Clicks: The Early Evidence
No one has published CTR data for AI review summaries in ads as of November 4, 2026. The closest evidence is a lab study of how people react to AI summaries of product reviews, shown in the table below.
| Measure | Value | Notes |
|---|---|---|
| Would buy, read AI-generated summary | 84% | Products included headsets, headlamps and radios |
| Would buy, read original reviews | 52% | Same products |
| Difference | +32 points; +61.5% relative | Our calculation |
| AI summaries that changed review sentiment | 26.5% | Across the models tested |
Source: Driven Metrics analysis of UC San Diego news release (Feb 9, 2026) on “Quantifying Cognitive Bias Induction in LLM-Generated Content,” presented at IJCNLP-AACL in December 2025. The researchers chose examples with strong framing shifts, so the gap is larger than a typical summary would produce.
- Participants who read an AI-generated review summary said they would buy 84% of the time, vs. 52% for those who read the original reviews, a 61.5% relative increase (our calculation, n=70).
- The mechanism is framing. The UC San Diego team found AI summaries changed the sentiment of the reviews in 26.5% of cases, and Google’s ad summaries are positive by design.
- Expect review summaries to affect conversion at least as much as CTR, and measure both.
We think the purchase-intent result is an upper bound, not a forecast. It comes from 70 people reading hand-picked examples, not from live ads.
How to Measure Ad CTR Before and After Review Summaries
In the table below, we lay out how to measure the reviews impact on ad CTR in your own account. Google’s help page lists no reporting column for review summaries, so the method relies on timing and a control group.
| Step | Formula or filter | Why |
|---|---|---|
| 1. Pick the window | 4 weeks before Oct 24, 2026 vs. 4 weeks after | Matches the documentation date; avoids Black Friday weeks |
| 2. Filter campaigns | Non-brand Search campaigns in US, UK, Australia or India, English | Where summaries can show |
| 3. Calculate CTR change | (CTR after / CTR before) – 1 | Relative change, same unit as Table 1 |
| 4. Subtract a control | Change in eligible campaigns – change in non-eligible campaigns (other markets or languages) | Removes seasonality and auction-wide shifts |
| 5. Check position | Compare top and absolute top impression share across both windows | A position change can move CTR on its own |
| 6. Check conversion | Conversion rate and CPA, same windows and control | Summaries are pitched on click quality |
Source: Driven Metrics method, November 2026. Google Ads Help reports store ratings performance in the account-level automated assets report for text ads; it lists no equivalent report for review summaries.
We will add first-party before-and-after results to this report once enough weeks of data exist after October 24, 2026.
- As of November 4, 2026, no published dataset measures CTR before and after AI review summaries in Google Search ads.
- A difference-in-differences test, eligible campaigns minus a control, is the cleanest option advertisers have without a reporting column.
- Start the clock at October 24, 2026 and keep your review profiles current, since the summary is built from them.
What Reviews Mean for Ad CTR in 2027
Star ratings still lift ad CTR, but by less than the numbers most guides repeat. Google’s own figure fell from 17% to 2% between 2011 and 2026, while the four independent studies put the median lift at 19%. AI review summaries move the effect from a score to a sentence Google writes, and the only behavioral evidence so far points to a bigger effect on whether people buy than on whether they click.
They also arrive while paid clicks are under pressure. In Seer Interactive’s study of 3,119 informational queries across 42 organizations, paid CTR on queries with AI Overviews fell from 19.70% in June 2024 to 6.34% in September 2025, a 67.8% drop, and from 19.1% to 13.04% on queries without them, a 31.7% drop (our calculation). Our AI Overview click-through rate report covers the organic side. Watch for three things in 2027: whether Google adds a reporting column for review summaries, whether it expands them beyond four English markets, and whether it publishes a CTR figure for them.
So if you are comparing review vendors or deciding how hard to push for reviews, look at how many recent reviews you have and what they say, not just the star average, because that text is now what Google puts in your ad.
Data Collection and Methodology
Unit of analysis. One row is one published estimate of how showing review stars or review text changes click-through rate or click share on a Google search result. Supporting rows record Google’s rating requirements, industry CTR benchmarks and AI summary findings.
Sample. We searched for studies of review and rating effects on ad CTR from October 30 to November 4, 2026 and opened every candidate page. The dataset holds 14 CTR estimates from 9 publications (7 for Google Search ads, 5 for BrightLocal’s Local Pack and organic test, 2 for Speero’s organic test), 5 rows of Google rating requirements, 23 industry CTR benchmarks, 3 AI summary findings and 4 paid CTR context figures: 53 rows in all.
Inclusion rules. A CTR estimate was included if it (1) gives a number for the change in CTR or click share when ratings or review content show on a Google search result, (2) states who measured it, and (3) could be opened at the original publisher on November 4, 2026. Estimates in the independent median also had to come from advertiser or agency account data, not Google.
Exclusions. We left out: a 10% to 15% merchant ratings figure from Yahoo, which no longer appears on Yahoo’s page; a 5% to 12% figure for Rev.com, found only on a case study aggregator; 5% to 15% and 10% to 17% ranges on vendor blogs with no original source; a Virginia Tech study of Tripadvisor summaries, which we could only find described in news coverage; and the 17% figure from a 2011 conference live blog, which repeats Google’s own figure. Amazon and Microsoft Advertising ratings were out of scope.
Definitions. CTR lift is the relative change in click-through rate, (CTR with ratings / CTR without) – 1. A percentage-point change is the simple difference between two shares. Seller ratings and store ratings are the same Google feature; Google’s documentation switched to “store ratings” by December 2024, according to PPC Land. AI review summaries are the AI-written review text Google documented for Search ads in October 2026.
Formulas. Independent median = median of 14%, 24%, 28.72% and -4.45% = 19.0%. Decline in Google’s figure = (17 – 2) / 17 = 88.2%. Review requirement increase = 100 / 30 = 3.3x. Implied BrightLocal no-rating share = reported 5-star share – reported 5-star difference (69 – 28 = 41 in the Local Pack; 19 – 7 = 12 in organic); the 4-star figures give the same baselines (59 – 18 = 41; 16 – 4 = 12). Relative change = share / baseline – 1. Conversions per impression change = (1 + CTR change) x (1 + conversion rate change) – 1. Extra clicks per 1,000 impressions = median CTR x 1,000 x lift. Purchase intent change = 84 / 52 – 1 = 61.5%. Seer drops = (start – end) / start. Days of testing = December 3, 2025 to October 24, 2026 = 325.
Rounding and firmness. Percentages are rounded to one decimal place unless the source gave more. Google’s figures are disclosed by Google; agency and advertiser figures are disclosed by the companies that ran the accounts; the Thought Shift figure is reported by Feefo. Google’s “up to 10%” is a ceiling, so it is shown but kept out of the median. Without the reported Thought Shift figure, the independent median is 14.0%.
Limits of the data
- Only four independent ad studies exist, all from 2014 to 2021, and agencies tend to publish wins.
- Most independent studies compare ads that showed ratings with ads that didn’t. Google decides when ratings show, so those groups may differ in position and auction.
- BrightLocal and Speero used mock search pages, and neither tested ads.
- Google’s 2% figure is undated and has no published method beyond “Google internal data.”
- WordStream’s CTRs are medians from campaigns on LocaliQ’s platform, mostly small and local businesses.
- No published data measures AI review summaries in live ads as of November 4, 2026.
To request the full dataset or a PDF copy of this report, contact Driven Metrics.
Further Reading
- Average Cost Per Lead in Google Ads 2026
- AI Overview Click-Through Rate 2026
- Google AI Mode Ads Statistics 2026
- Zero-Click Search Statistics 2026
About the Author
Emily Connor is the Founder and CEO of Driven Metrics, an SEO and GEO agency. She works with companies on search and AI visibility strategy, reporting and content, and leads Driven Metrics’ research on how AI search is changing the way buyers find businesses.
Sources
- Driven Metrics analysis of 14 published estimates of review and rating effects on Google search click-through rate (2011 to 2026), Google rating requirements, 2026 industry CTR benchmarks and AI review summary findings, captured November 4, 2026, conducted November 2026. Dataset: reviews-impact-on-ad-ctr-dataset.csv.
- Google Ads Help, “About store ratings,” undated, accessed November 4, 2026. https://support.google.com/google-ads/answer/2375474
- Google, Inside AdWords, “5 Simple Ways to Improve Your AdWords Performance,” Dan Friedman, 2011. https://adwords.googleblog.com/2011/04/5-simple-ways-to-improve-your-adwords.html
- Google, “Google Customer Reviews: receive and share customer feedback while earning seller ratings,” Aaron Berger and Jorge Cueto, April 3, 2017. https://blog.google/products-and-platforms/products/ads/google-customer-reviews-receive-and/
- Metric Theory, “Google Seller Ratings: A Paid Search Home Run,” Cindy He, August 18, 2016. https://metrictheory.com/blog/google-seller-ratings-a-paid-search-home-run/
- PPC Hero, “How Seller Ratings Helped Increase Conversions by 50%,” Cassie Oumedian, June 24, 2014. https://ppchero.com/how-seller-ratings-helped-increase-conversions-by-50/
- WordStream, guest post on Google seller and product ratings, Oliver Ewbank (Feefo), February 9, 2016. https://www.wordstream.com/blog/ws/2016/02/09/google-ratings
- Trustpilot, “How to calculate the impact of Google Seller Ratings on your click-through-rate,” May 28, 2021. https://fi.business.trustpilot.com/blog/get-seen-in-search/how-to-calculate-google-seller-ratings-effect-on-google-ads
- BrightLocal, “Impact of Reviews and Ratings on Search Click-Through Rates,” Sherry Bonelli, April 25, 2017. https://www.brightlocal.com/research/review-search-click-through-study/
- Speero (CXL Institute), “Do Review Stars on Google Help Click-Through Rate? [Original Study],” Ben Labay, October 26, 2017. https://speero.com/post/do-review-stars-on-google-help-click-through-rate-original-study
- WordStream by LocaliQ, “2026 Google Ads Benchmarks,” Susie Marino, 2026, accessed November 4, 2026. https://www.wordstream.com/blog/2026-google-ads-benchmarks
- PPC Land, “Google AI writes positive-only review summaries into Search ads in 4 markets,” Luis Rijo, October 25, 2026. https://ppc.land/google-ai-writes-positive-only-review-summaries-into-search-ads-in-4-markets/
- PPC Land, “Review summaries,” Luis Rijo, October 25, 2026. https://ppc.land/review-summaries/
- PPC Land, “Seller ratings,” Luis Rijo, October 25, 2026. https://ppc.land/seller-ratings/
- University of California San Diego, “How much does chatbot bias influence users? A lot, it turns out,” EurekAlert, February 9, 2026. https://www.eurekalert.org/news-releases/1115760
- Seer Interactive, “AIO Impact on Google CTR: September 2025 Update,” Tracy McDonald, November 4, 2025. https://www.seerinteractive.com/insights/aio-impact-on-google-ctr-september-2025-update
Driven Metrics research · November 2026
By Emily Connor, Founder and CEO, Driven Metrics · Published November 2026 · Updated November 2026