
Key Findings
Driven Metrics analyzed the first large dataset on ChatGPT ad performance, covering 102 advertiser websites with full revenue tracking, plus every other ChatGPT ads conversion figure we could trace to its source in 2026:
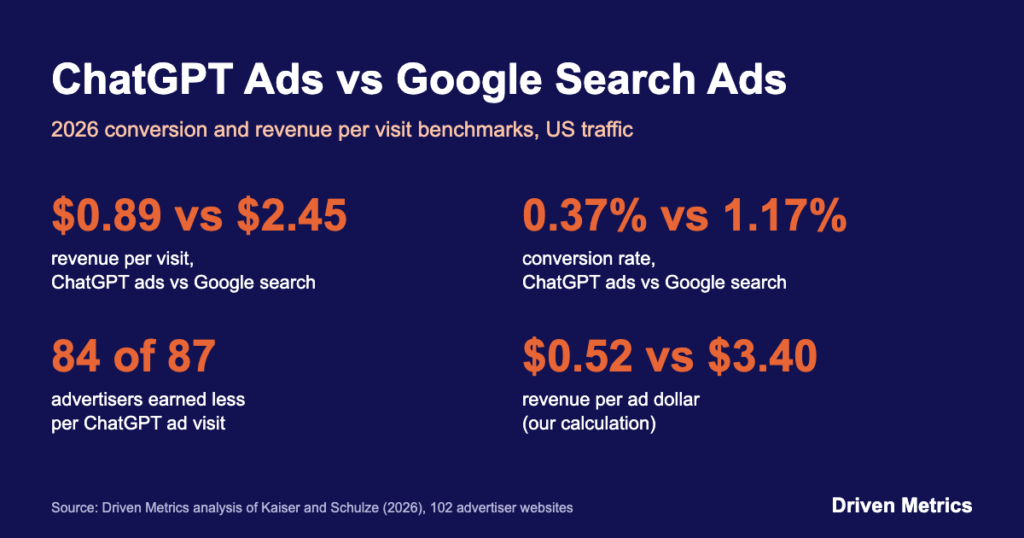
- The ChatGPT ads conversion rate was 0.37% for US visitors to 102 advertiser websites in data through August 22, 2026, against 1.17% for Google paid search on the same websites, 68.4% lower (our calculation).
- A paid ChatGPT visit generated $0.89 in revenue for US advertisers in data through August 2026, compared with $2.45 for a Google paid search visit, a 64% shortfall.
- At the $1.72 cost per click paid by the largest publicly reported ChatGPT ads account in June 2026, each ChatGPT ad dollar returned $0.52 in revenue, compared with $3.40 for Google search at a $0.72 click, a 6.6 times gap (our calculation).
- 84 of 87 US advertisers (96.6%) that bought both ChatGPT ads and Google paid search between February and August 2026 earned less per ChatGPT ad visit, and 73 of them (83.9%) recorded no ChatGPT ad sale at all.
- Measured and disclosed ChatGPT ads conversion rates published in 2026 ranged from 0% for one advertiser to 2.35% for one 15-day account, and the only figure measured across more than a handful of advertisers, 0.37%, sat near the bottom of that range (our calculation, 4 sources, excluding projections).
ChatGPT started showing ads in the US on February 9, 2026, and opened self-serve buying to all US businesses in May. Advertisers had click-through and cost data from the start, but almost no public data on what those clicks were worth. In October 2026, economists Maximilian Kaiser (Vienna University of Economics and Business) and Christian Schulze (Frankfurt School of Finance & Management) released a working paper that measured it on real store revenue. In this report, the ChatGPT ads conversion rate is the share of visits from a paid ChatGPT ad click that end in a purchase, and revenue per visit is revenue divided by those visits.
Our analysts built a dataset of 90 data points from 8 sources dated June to November 2026. Its core is the paper’s channel data for 102 advertiser websites with full revenue tracking, which covers 194,367 paid ChatGPT sessions from June 29, 2025 to August 22, 2026. We used it to calculate visits per sale, revenue per ad dollar, ad cost per sale and break-even click prices, then compared the results with three advertiser and agency disclosures, one agency projection, OpenAI’s bidding guidance and WordStream’s 2026 Google Ads benchmarks. The full dataset is available as a CSV download.
In the following sections, we compare ChatGPT ads with Google paid search, rank five traffic channels by revenue per visit, calculate ChatGPT ads ROI at different click prices, count how many advertisers made money, reconcile the published conversion benchmarks and check whether ads changed organic ChatGPT traffic.
ChatGPT Ads Conversion Rate vs Google Search Ads
In the table below, we compare ChatGPT ads with Google paid search on the same 102 advertiser websites, for US visitors and for all visitor countries, with two metrics we derived from the paper’s totals.
| Metric | ChatGPT ads, US | Google paid search, US | ChatGPT ads, all countries | Google paid search, all countries |
|---|---|---|---|---|
| Conversion rate | 0.37% | 1.17% | 0.31% | 1.33% |
| Average order value | $240 | $209 | $236 | $154 |
| Revenue per visit | $0.89 | $2.45 | $0.73 | $2.05 |
| Visits per sale | 270 | 85 | 323 | 75 |
| Revenue per 1,000 visits | $890 | $2,450 | $730 | $2,050 |
Source: Driven Metrics analysis of Kaiser and Schulze (2026), Table J.1, November 2026. Note: rates are pooled totals across all 102 websites, so larger advertisers carry more weight. Visits per sale = 100 ÷ conversion rate. Revenue per 1,000 visits = revenue per visit × 1,000. ChatGPT ads ran in the US from February 9, 2026; paid search covers the full window.
- ChatGPT ads converted at 0.37% for US visitors, 0.80 percentage points below Google paid search at 1.17% on the same 102 websites, so it took about 270 ChatGPT ad visits to produce one sale against 85 from paid search (our calculation).
- The gap comes from how often visitors buy, not from smaller baskets across the board. Pooled ChatGPT ad orders averaged $240 against $209 for search, but within the same website, ChatGPT ad orders were $74 smaller after the authors adjusted for device and week.
- The shortfall is not a US-only effect: across all visitor countries, ChatGPT ads converted at 0.31% against 1.33% and earned 64.4% less per visit (our calculation).
Revenue per Visit by Channel: ChatGPT Ads vs Paid Search, Organic ChatGPT, Organic Search and Direct
In the table below, we rank five traffic channels on the same 102 advertiser websites by revenue per visit for US visitors in data through August 2026, and show ChatGPT ads’ revenue per visit as a share of each channel’s.
| Channel | Revenue per visit | Conversion rate | Average order value | Visits per sale | ChatGPT ads revenue per visit as % of channel |
|---|---|---|---|---|---|
| Organic ChatGPT | $3.27 | 1.22% | $268 | 82 | 27.2% |
| Paid search (Google) | $2.45 | 1.17% | $209 | 85 | 36.3% |
| Direct | $1.70 | 0.86% | $197 | 116 | 52.4% |
| Organic search | $1.25 | 0.68% | $185 | 147 | 71.2% |
| Paid ChatGPT (ChatGPT ads) | $0.89 | 0.37% | $240 | 270 | 100% |
Source: Driven Metrics analysis of Kaiser and Schulze (2026), Table J.1, November 2026. Note: organic ChatGPT means clicks on links inside ChatGPT answers; paid ChatGPT means clicks on ChatGPT ads. Visits per sale and the last column are our calculations.
- ChatGPT ads ranked last of five channels on revenue per visit for US visitors, at $0.89, while organic ChatGPT referrals to the same websites ranked first at $3.27, 3.7 times as much (our calculation).
- That split points at the ad unit, not at ChatGPT’s audience. Kaiser and Schulze suggest one reason: the sponsored cards sit apart from the answer, while organic referrals come from links inside it.
- Track organic ChatGPT referrals and ChatGPT ad clicks as separate channels in your analytics. Combining them would hide a $2.38 per visit gap in this data (our calculation). Our AI referral traffic statistics cover the organic side in more depth.
ChatGPT Ads ROI: Revenue per Ad Dollar and Cost per Sale
In the table below, we combine the study’s US revenue per visit and conversion rates with published click prices to show what each ad dollar returned and what one sale cost in ad spend in 2026.
| Scenario | Cost per click | Revenue per ad dollar | Ad cost per sale | Click price source |
|---|---|---|---|---|
| Google paid search, study median CPC | $0.72 | $3.40 | $61.54 | Kaiser and Schulze, 16 US accounts |
| Google paid search, 40,183-account median CPC | $1.01 | $2.43 | $86.32 | Kaiser and Schulze, pre-launch |
| ChatGPT ads at the parity price | $0.26 | $3.40 | $70.81 | Kaiser and Schulze parity price |
| ChatGPT ads, one B2B client’s CPC | $0.76 | $1.17 | $205.41 | Stubgroup case study |
| ChatGPT ads, largest public account’s CPC | $1.72 | $0.52 | $464.86 | Opascope, June 2026 |
| ChatGPT ads, OpenAI suggested starting bid (low) | $3.00 | $0.30 | $810.81 | OpenAI Help Center |
| ChatGPT ads, OpenAI suggested starting bid (high) | $5.00 | $0.18 | $1,351.35 | OpenAI Help Center |
Source: Driven Metrics analysis of Kaiser and Schulze (2026), Opascope, Stubgroup and the OpenAI Help Center (accessed November 17, 2026), November 2026. All figures are our calculations. Note: revenue per ad dollar = revenue per visit ÷ cost per click. Ad cost per sale = cost per click ÷ conversion rate. Every ChatGPT row uses the study’s US figures ($0.89 per visit, 0.37% conversion) and every search row uses $2.45 and 1.17%, including rows whose click price comes from other advertisers. Figures are revenue, not profit.
- At the $1.72 click price reported for the largest public ChatGPT ads account in June 2026, a ChatGPT ad dollar returned $0.52 in revenue for US advertisers, against $3.40 for Google search at the study’s $0.72 median click, a 6.6 times gap in value for money (our calculation).
- ChatGPT ads matched search’s return only at about $0.26 a click, the study’s parity price (resampled range $0.05 to $0.57), and covered their own cost in revenue only below $0.89 a click. OpenAI’s Help Center suggests starting CPC bids at $3 to $5.
- At a $3 bid, one ChatGPT ad sale would cost about $811 in ad spend against a $240 average order (our calculation). Advertisers testing at the suggested bids should expect to spend more than the order is worth unless their own conversion rate is several times the study average.
How Many Advertisers Made Money From ChatGPT Ads
In the first table below, we show how the advertisers that bought both ChatGPT ads and Google paid search compared, website by website, from February to August 2026. The second table shows where individual websites landed on ChatGPT ads conversion rate and revenue per visit.
| Measure | US traffic | All visitor countries |
|---|---|---|
| Advertisers buying both paid channels | 87 | 101 |
| Earned less per ChatGPT ad visit than per paid search visit | 84 (96.6%) | 97 (96.0%) |
| Converted ChatGPT ad visits at a lower rate | 85 (97.7%) | 98 (97.0%) |
| Recorded no ChatGPT ad sale | 73 (83.9%) | 83 (82.2%) |
| Paid ChatGPT sessions at advertisers with no sale | 18,726 | 23,885 |
| Recorded at least one ChatGPT ad sale | 14 (16.1%) | 18 (17.8%) |
| ChatGPT ad sales at those advertisers | 570 | 603 |
Source: Driven Metrics analysis of Kaiser and Schulze (2026), Table K.1, November 2026. Note: percentages are our calculations from the paper’s counts.
| Website or account | ChatGPT ads conversion rate | ChatGPT ads revenue per visit |
|---|---|---|
| Largest publicly reported account (Opascope, 15 days) | 2.35% | $2.56 (implied) |
| Largest paid account in the study (52,232 sessions) | 0.76% | $1.99 |
| 90th percentile website in the study | 0.14% | $0.25 |
| Median website in the study | 0.00% | $0.00 |
Source: Driven Metrics analysis of Kaiser and Schulze (2026), Table N.2, and Opascope, November 2026. Note: the Opascope account’s revenue per visit is implied from its reported 1.49x return at $1.72 per click. 18 of the 102 websites recorded any paid ChatGPT sale. One website matched the Opascope account on both measures, on 9 paid ChatGPT sessions.
- 84 of 87 US advertisers (96.6%) that bought both channels earned less per ChatGPT ad visit than per Google paid search visit, and 73 (83.9%) recorded no ChatGPT ad sale across 18,726 paid ChatGPT sessions between them, in data through August 2026.
- Results were concentrated. 14 advertisers produced all 570 US ChatGPT ad sales, and one advertiser held 66% of all paid ChatGPT purchases and 76% of US paid ChatGPT revenue. Dropping that advertiser made the gap with search wider, not narrower.
- The median website converted 0.00% of its ChatGPT ad visits, so a strong public case study, such as the 2.35% account Opascope reported in June 2026, describes the top of the range rather than a typical result.
The zero-sale count is not just small numbers. If each advertiser’s ChatGPT ad visits had converted at its own paid search rate, the authors estimate about 42 of the 87 would still show no sale by chance. 73 did.
Published ChatGPT Ads Conversion Rate Benchmarks Compared
In the table below, we list every published ChatGPT ads conversion figure we could trace to its original publisher in 2026, with the Google comparison each source gives. Populations and conversion definitions differ, so we label how firm each figure is.
| Source | Population and period | What counts as a conversion | ChatGPT ads conversion rate | Google comparison | Firmness |
|---|---|---|---|---|---|
| Kaiser and Schulze, US traffic | 102 advertiser websites, June 2025 to August 2026 | Online sale | 0.37% | 1.17% (paid search) | Measured, working paper under review |
| Kaiser and Schulze, all countries | Same | Online sale | 0.31% | 1.33% (paid search) | Measured, working paper under review |
| Opascope | One account, about $60,000 over 15 days (published June 15, 2026) | Not stated | 2.35% | None given | Disclosed by agency, one account |
| First Page Sage, e-commerce / retail | Client campaign data through October 27, 2026; client count not stated | Not defined | 2.4% (projected) | 1.4% (Google Ads) | Projected by agency |
| Stubgroup | One B2B compliance services client, 30 days (page updated November 9, 2026) | Lead | 0.8% | 6.64% (Google search ads) | Disclosed by agency, one client |
| Barn2 | One WordPress software seller, June 1 to July 14, 2026 | Sale | 0% (0 sales from 370 clicks) | None given | Self-reported, one advertiser |
| WordStream by LocaliQ | 13,474 US search campaigns, April 2025 to March 2026 | Campaign conversion (mostly leads) | None | 8.18% median (Google and Microsoft Ads) | Measured, platform benchmark |
Source: Driven Metrics analysis of the sources linked in each row, November 2026. Note: the Barn2 conversion rate is our calculation from its reported clicks and sales.
- Measured and disclosed ChatGPT ads conversion figures for 2026 ran from 0% to 2.35%, and the only one measured across many advertisers, 0.37% for US traffic on 102 websites, sits near the bottom of that range. The one projection, First Page Sage’s 2.4% for e-commerce, sits above all of them.
- Sources disagree on direction because they measure different things. Kaiser and Schulze and Stubgroup measured actual conversions and found ChatGPT ads converting at 32% and 12% of the Google rate (our calculation), while First Page Sage’s e-commerce projection puts ChatGPT ads at 1.71 times Google Ads.
- Before you plan around any ChatGPT ads conversion rate, check whether it is measured or projected, whether it counts sales or leads, and how many advertisers it covers.
One nuance from Stubgroup’s case: ChatGPT ads still produced cheaper leads for that client, $92.21 against $157.57 (41.5% lower, our calculation), because its Google clicks cost 13.8 times as much ($10.46 against $0.76). Stubgroup reported that the Google leads turned into customers at a much higher rate, which reversed the result at the customer level.
Do ChatGPT Ads Reduce Organic ChatGPT Traffic?
In the table below, we list the paper’s estimates of what the ad launch did to organic ChatGPT referrals, measured on 1,898 online shops by comparing countries that got ads with the European Union, which did not have them before the data window closed.
| Measure | Estimated change | Sample |
|---|---|---|
| Organic ChatGPT referral volume, first 13 weeks after launch | -5.9% (95% interval -12.6% to +1.2%) | 1,898 websites |
| Same, adjusted for faster ChatGPT usage growth in North America | -7.2% to -8.4% | 1,898 websites |
| Organic ChatGPT conversion rate | -0.02 percentage points from a 2.21% baseline (p=.648) | 1,898 websites |
| Organic ChatGPT traffic at advertisers after their first paid click | +8.2% (95% interval -18% to +43%) | 305 matched advertiser pairs |
Source: Driven Metrics analysis of Kaiser and Schulze (2026), Findings 2.1 and 2.2 and Table N.1, November 2026. Note: the first three rows compare countries with ads against the European Union, where ads launched August 24, 2026, two days after the data window closed.
- After ads launched, organic ChatGPT referrals to 1,898 online shops fell an estimated 5.9% over 13 weeks, or 7.2% to 8.4% after adjusting for faster usage growth in North America, while visitors who still arrived converted as before, at about 2.21%.
- Buying ChatGPT ads showed no detectable lift in an advertiser’s own organic ChatGPT traffic (+8.2%, not distinguishable from zero across 305 matched pairs), though the test could only rule out lifts of about 50% or more.
- In 2026 data, organic visibility in ChatGPT answers and paid ChatGPT ads behaved like separate channels: paying for one did not measurably raise the other.
What ChatGPT Ads Conversion Data Means for Advertisers in 2027
The first large measurement of ChatGPT ads shows a channel that converts and earns far less per visit than Google paid search on the same websites, and most advertisers in the study made no sales from it through August 2026. The study is a working paper under review and covers mostly online stores, so lead generation may look different, as Stubgroup’s cheaper leads show.
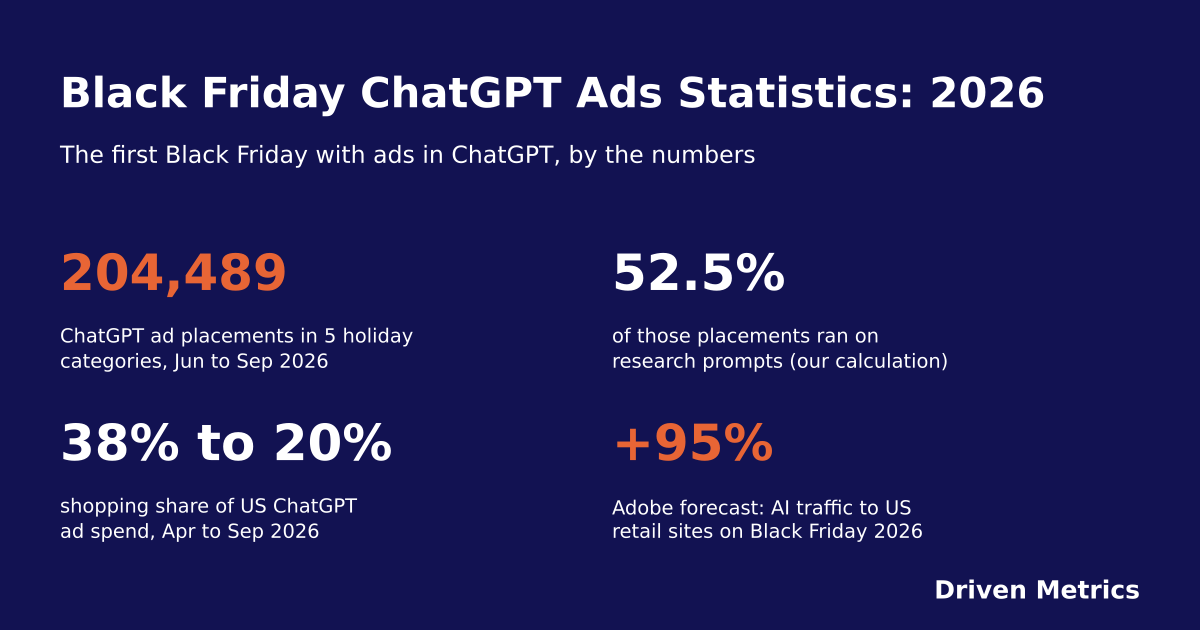
Three things to watch in 2027: whether the conversion-optimized campaigns OpenAI began rolling out in June 2026 lift conversion, whether ChatGPT click prices move toward what the clicks return, and whether a later version of the paper with more weeks of ad data changes the gap. Our Black Friday ChatGPT ads statistics track the platform’s ad volume and pricing heading into the 2026 holiday season.
So if you are comparing ChatGPT ads with Google Ads, look at revenue per visit and ad cost per sale in your own analytics, not click-through rate, and set your ChatGPT maximum bid from your own revenue per visit rather than from the suggested starting bid.
Data Collection and Methodology
Unit of analysis. Each row in our dataset is one published data point: a value, what it measures, the channel, the geography, the population, the period, the source, the exact URL and the date we captured it. The dataset has 90 rows from 8 sources. 30 rows are the core channel table from Kaiser and Schulze (5 channels × 2 geographies × 3 metrics).
Inclusion rules. We included figures on the conversion, revenue or cost performance of ads in ChatGPT published from June 1 to November 17, 2026, plus the Google search comparisons published with them and WordStream’s 2026 Google Ads benchmark. We excluded figures we could not trace to an original publisher, including claims that ChatGPT ads convert 2 to 3 times higher than Google Shopping that named no source, and conversion figures for organic ChatGPT referrals rather than ads, except the organic channel in the Kaiser and Schulze comparison. We did not include click-through or impression data.
The core study. Kaiser and Schulze, “Can Advertising Fund Free AI? Evidence from ChatGPT’s International Advertising Rollout,” version 1, October 2026, under review. It uses Google Analytics 4 data from Grips Intelligence, which provided it free of charge; Kaiser is a scientific advisor to the firm, and the authors state it had no role in the research. The data covers 60 weeks from June 29, 2025 to August 22, 2026 and nearly 10 billion sessions. The paid comparison uses 387 websites with paid ChatGPT traffic, of which 102 have full revenue tracking and more than ten transactions. ChatGPT ads launched in the US on February 9, 2026. The authors describe the paid comparison as descriptive, not causal, because advertisers chose to advertise.
Definitions. Conversion rate is transactions divided by sessions (Kaiser and Schulze, Barn2) or conversions divided by clicks as each source reports it (Stubgroup counts leads). Revenue per visit is revenue divided by sessions. Paid ChatGPT means sessions tagged as coming from a ChatGPT ad click; organic ChatGPT means clicks on links inside ChatGPT answers. Pooled figures are ratios of totals across all websites. US traffic means visitors located in the US. Parity price is the cost per click at which a ChatGPT ad click returns as much revenue per ad dollar as a paid search click.
Firmness. We label each figure measured (a study or platform benchmark with a stated sample), disclosed (an agency or advertiser reporting its own account), or projected (an estimate for planning).
Formulas.
- Visits per sale = 100 ÷ conversion rate (%)
- Revenue per 1,000 visits = revenue per visit × 1,000
- ChatGPT ads revenue per visit as % of channel = $0.89 ÷ channel revenue per visit × 100
- Revenue per ad dollar = revenue per visit ÷ cost per click
- Ad cost per sale = cost per click ÷ (conversion rate ÷ 100)
- Parity price = $0.72 × ($0.89 ÷ $2.45) = $0.26 (the authors’ formula, which we reproduced)
- Value-for-money gap = ($2.45 ÷ $0.72) ÷ ($0.89 ÷ $1.72) = 6.6
- Implied revenue per visit for the Opascope account = 1.49 × $1.72 = $2.56
Rounding and currency. All money is in US dollars. Conversion rates are shown to two decimals, shares to one decimal and visits per sale to whole numbers. We calculated from the published rounded inputs, so small differences from the paper are possible; for example, the value-for-money gap is 6.58 from rounded inputs and 6.57 in the paper, and both round to 6.6.
Limits of the data.
- The core study is a working paper under review, and its figures may change in later versions.
- The 102 websites are mostly online stores, and the data captures the last click in Google Analytics, so purchases made later or after viewing an ad without clicking are not counted.
- One advertiser accounts for 66% of paid ChatGPT purchases, so the pooled figures are sensitive to it, although the authors show that dropping it widens the gap.
- Our ROI scenarios apply the study’s revenue per visit to click prices from other advertisers and from OpenAI’s guidance; they show what those prices would mean at the study’s performance, not what any advertiser earned.
- Opascope, Stubgroup and Barn2 each describe a single account, and First Page Sage does not publish how its projections are calculated.
- The data ends August 22, 2026, before the EU launch, the expansion to more countries and the 2026 holiday season.
To request the full dataset or a PDF copy of this report, contact Driven Metrics, or download the dataset (CSV).
Further Reading
- Black Friday ChatGPT Ads Statistics: 2026 Report
- AI Referral Traffic Statistics 2026: Share of Visits, Growth, Platforms and Conversion
- Average Cost Per Lead in Google Ads 2026
- Google AI Mode Ads Statistics 2026
About the Author
Emily Connor is the Founder and CEO of Driven Metrics, an SEO and generative engine optimization agency. She works with brands on how they show up in Google and in AI answers from ChatGPT, Perplexity and Google’s AI features, and leads Driven Metrics’ original research. More about Driven Metrics.
Sources
- Driven Metrics analysis of published ChatGPT ads conversion, revenue and cost data, 90 data points from 8 sources dated June to November 2026, conducted November 2026. Dataset (CSV).
- Kaiser, M., and Schulze, C. “Can Advertising Fund Free AI? Evidence from ChatGPT’s International Advertising Rollout.” Working paper, version 1, October 2026, under review. Study page: https://ecommerceresearch.org/chatgpt-ads/. Full text: https://ecommerceresearch.org/chatgpt-ads/Kaiser-Schulze-2026-Can-Advertising-Fund-Free-AI.md. Accessed November 17, 2026.
- Frankfurt School of Finance & Management. “ChatGPT advertising delivers more than six times less value for money than Google Ads.” Press release, November 3, 2026. https://www.frankfurt-school.de/en/news/2026/11/chatgpt-advertising-delivers-more-than-six-times-less-value-for-money-than-google-ads-
- OpenAI Help Center. “Ads in ChatGPT: The Basics.” Accessed November 17, 2026. https://help.openai.com/en/articles/20001207-ads-in-chatgpt-the-basics
- Thilén, A. “ChatGPT Ads Benchmarks: ROAS, CPC, and Cost From 15 Days of Real Spend.” Opascope, June 15, 2026. https://opascope.com/insights/chatgpt-ads-benchmarks/
- Stubgroup. “ChatGPT Ads Case Study.” Last updated November 9, 2026. Accessed November 17, 2026. https://stubgroup.com/case-study/chatgpt-ads-case-study/
- Keith, K. “ChatGPT ads don’t work yet. Here’s the proof.” Barn2, October 6, 2026. https://barn2.com/blog/chatgpt-ads-results/
- First Page Sage. “ChatGPT Ads Conversion Rate: 2026 Report.” Updated November 2, 2026. Accessed November 17, 2026. https://firstpagesage.com/seo-blog/chatgpt-ads-conversion-rate/
- Marino, S. “2026 Google Ads Benchmarks.” WordStream by LocaliQ. Data April 1, 2025 to March 31, 2026. Accessed November 17, 2026. https://wordstream.com/blog/2026-google-ads-benchmarks
Driven Metrics research · November 2026