
Key Findings
- In Driven Metrics’ analysis of 55,198 AI answers to 18,400 buyer questions in 35 US markets (October 14 to 17, 2026), google.com was the most-cited domain in Google AI Mode in 17 of 35 markets (our calculation).
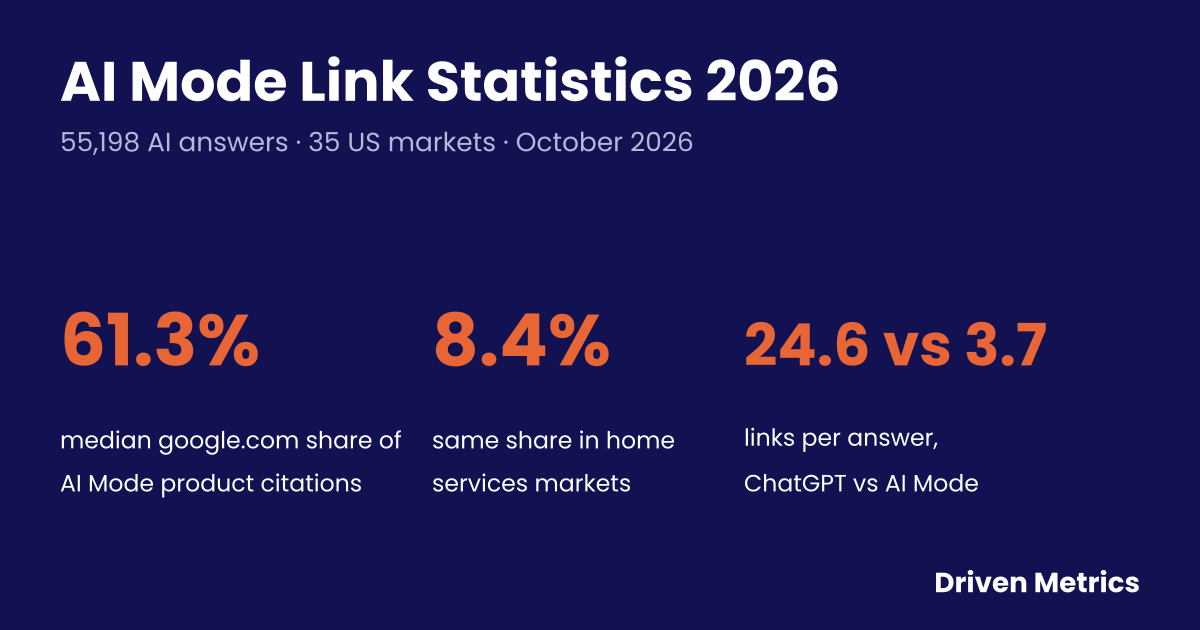
- Across 11 physical-product markets, google.com took a median 61.3% of AI Mode citations in October 2026, against 8.4% across 7 home service markets (our calculation, n=35 markets).
- ChatGPT attached 24.6 cited URLs to an average answer and Google AI Mode attached 3.7 in Findrix’s October 2026 data, so ChatGPT showed 6.6 times as many links per answer (our calculation).
- Once google.com is set aside, an AI Mode answer about swimwear carried an estimated 1.1 links to other websites in October 2026, compared with 24.6 total links in an average ChatGPT answer (our calculation, estimate).
- In all 7 legal and finance markets measured in October 2026, google.com received 3.1% or less of AI Mode citations, so AI Mode’s links in those markets went almost entirely to outside sites (our calculation).
On October 29, 2026, Search Engine Land reported a Findrix study showing that 57% of the links in Google AI Mode’s product answers pointed to Google Shopping pages, while only 5.1% of AI Mode’s links for local services such as plumbers, lawyers and dentists went to Google pages. AI mode link statistics answer a simple question for anyone who needs traffic from Google: when AI Mode answers a buyer, how many links does it show, and how many of those leave Google?
To answer it, our analysts compiled the domain-citation tables Findrix published for all 35 US markets in its Radar dataset: 18,400 buyer questions asked once each to ChatGPT, Gemini and Google AI Mode between October 14 and 17, 2026, for 55,198 answers in total. That gave us 420 market-by-domain rows. We then compared them with six other published link studies from Findrix, LLM Pulse, SE Ranking, Semrush, GrowByData and Profound. In this report, a link or citation is a URL an AI engine shows with its answer, either inline or in a source list.
In the following sections, we compare links per answer across AI platforms, break down how often AI Mode links to google.com in each of 35 markets, estimate how many outside links a typical answer leaves, and list which sites AI Mode, ChatGPT and Gemini link to instead.
AI Mode Links per Answer vs ChatGPT and Gemini
In the table below, we compare how many links Google AI Mode attaches to an answer with ChatGPT, Gemini and other AI platforms, using five published studies from June 2025 to November 2026.
| Study and date | Sample | ChatGPT | Google AI Mode | Gemini | ChatGPT links per AI Mode link |
|---|---|---|---|---|---|
| Findrix, Oct 14 to 19, 2026 | 38,400 buyer questions, 39 niches, US and Australia | 24.6 | 3.7 | 5.2 | 6.6x |
| Findrix via Search Engine Land, Oct 14 to 17, 2026 | 55,198 answers, 35 US markets | about 25 | about 3 | not reported | about 8.3x |
| LLM Pulse, 7 days to Nov 1, 2026 | Answers with at least 1 citation; sample size not stated | 23.31 | 5.01 | 4.43 | 4.7x |
| SE Ranking, Jun 20, 2025 | 9,734 AI Mode answers, 10,000 US keywords | not measured | 12.6 | not measured | n/a |
| Semrush, published Jul 21, 2025 | 5,000 keywords; collection date not stated | not reported | 7 unique domains in sidebar | not measured | n/a |
Source: Driven Metrics analysis of Findrix, Search Engine Land, LLM Pulse, SE Ranking and Semrush, November 2026. Note: LLM Pulse also reported 10.77 citations per Perplexity answer and 8.64 per AI Overview. Studies count links differently: Findrix and LLM Pulse count distinct cited sources, SE Ranking counts every link in the answer and its source panel, and Semrush counts unique domains.
Key Findings
- ChatGPT showed 4.7 to 6.6 times as many cited links per answer as Google AI Mode in the two fall 2026 datasets, 23.31 to 24.6 links against 3.7 to 5.01 (our calculation).
- Part of the gap is display. In Findrix’s October 2026 data, about 65% of ChatGPT’s links sat only in its Sources panel, which most readers never open, while AI Mode showed a handful of links with the answer itself.
- For a business, one ChatGPT citation and one AI Mode citation are not worth the same. A link that is one of about 4 is far more visible than one of about 25.
We would not read the drop from SE Ranking’s 12.6 links in June 2025 to 3.7 to 5.01 in late 2026 as a clean trend. SE Ranking counted every link in the answer and its source panel, while Findrix and LLM Pulse counted distinct cited sources, so the methods explain much of the gap.
How Often AI Mode Links to google.com, by Market
In the table below, we list google.com’s share of Google AI Mode citations in each of the 35 US markets Findrix measured from October 14 to 17, 2026, along with its share of ChatGPT citations in the same markets.
| Market | Group | Answers (3 engines) | google.com share of AI Mode citations | google.com is AI Mode’s top domain | google.com share of ChatGPT citations |
|---|---|---|---|---|---|
| Swimwear and resortwear | Physical products | 2,400 | 70.4% | Yes | <0.1% |
| Women’s everyday fashion | Physical products | 2,400 | 68.0% | Yes | <0.1% |
| Activewear | Physical products | 2,400 | 67.7% | Yes | <0.1% |
| Sun care and self-tanning | Physical products | 2,400 | 66.1% | Yes | <0.1% |
| Haircare | Physical products | 2,400 | 63.4% | Yes | <0.1% |
| Makeup and cosmetics | Physical products | 2,400 | 61.3% | Yes | 1 citation |
| Jewelry | Physical products | 2,400 | 59.7% | Yes | <0.1% |
| Facial skincare | Physical products | 2,400 | 58.6% | Yes | <0.1% |
| Oral care products | Physical products | 2,400 | 49.4% | Yes | 0.1% |
| Pet food and nutrition | Physical products | 2,400 | 48.8% | Yes | 0.1% |
| Dermatology and aesthetic medicine | Healthcare | 1,200 | 20.8% | Yes | 3.4% |
| Heating and air conditioning | Home services | 1,200 | 13.4% | Yes | 3.5% |
| Sports nutrition and supplements | Physical products | 2,400 | 13.2% | Yes | 0.1% |
| Pool and spa services | Home services | 1,200 | 11.4% | No (thumbtack.com, 11.6%) | 3.4% |
| Dental and orthodontic | Healthcare | 1,200 | 9.8% | Yes | 4.4% |
| Roofing | Home services | 1,200 | 8.7% | Yes | 2.6% |
| Solar and battery installation | Home services | 1,200 | 8.4% | Yes | 1.6% |
| Plumbing services | Home services | 1,200 | 7.4% | No (rotorooter.com, 9.0%) | 2.9% |
| Pest control and wildlife removal | Home services | 1,200 | 7.2% | No (terminix.com, 13.4%) | 1.7% |
| Physical therapy and rehab | Healthcare | 1,200 | 5.5% | Yes | 3.6% |
| Accounting software | Software | 1,200 | 4.0% | No (youtube.com, 6.3%) | 1 citation |
| Psychological therapy and assessment | Healthcare | 1,200 | 2.9% | No (nih.gov, 7.0%) | 1.4% |
| Electrical services | Home services | 1,200 | 1.8% | No (fsg.com, 6.1%) | 5.8% |
| Personal injury law | Legal | 1,200 | 0.8% | No (bestlawfirms.com, 5.5%) | 1.6% |
| Family law | Legal | 1,200 | 0.3% | No (chambers.com, 6.7%) | 2.7% |
| Field service software | Software | 1,200 | 3.8% or less | No (servicetitan.com, 5.3%) | not in top 12 |
| Wealth management and advice | Finance | 1,200 | 3.1% or less | No (wsj.com, 11.8%) | not in top 12 |
| HR and payroll software | Software | 1,198 | 3.1% or less | No (forbes.com, 6.1%) | not in top 12 |
| Residential closing and title | Legal | 1,200 | 3.0% or less | No (revenuebase.ai, 3.0%) | not in top 12 |
| Addiction treatment | Healthcare | 1,200 | 2.6% or less | No (americanaddictioncenters.org, 11.3%) | not in top 12 |
| Mortgage and home financing | Finance | 1,200 | 2.6% or less | No (cnbc.com, 11.7%) | not in top 12 |
| Psychiatric care | Healthcare | 1,200 | 2.3% or less | No (nih.gov, 5.7%) | not in top 12 |
| Tax preparation and accounting | Finance | 1,200 | 1.7% or less | No (institutionhq.com, 4.0%) | not in top 12 |
| Criminal defense | Legal | 1,200 | 1.7% or less | No (chambers.com, 3.4%) | not in top 12 |
| Marketing software | Software | 1,200 | 1.7% or less | No (youtube.com, 3.4%) | not in top 12 |
Source: Driven Metrics analysis of Findrix Radar market pages for 35 US markets, captured November 3, 2026. Note: Findrix lists the 12 domains with the highest citation share on any engine in each market. Where google.com is not listed, its share is at or below the lowest share listed for that market, shown as “or less.” “Top domain” compares google.com with the other 11 listed domains.
Key Findings
- google.com was the single most-cited domain in AI Mode in 17 of 35 US markets in October 2026, and it took 48.8% or more of AI Mode citations in all 10 fashion, beauty and pet markets (our calculation).
- The markets where google.com dominates are the ones where Google holds product data: price, stock and reviews. That matches Findrix co-founder Yosif Merman’s explanation, reported by Search Engine Land, that Google’s product database lets AI Mode answer with fewer outside links.
- In service markets, AI Mode still sends most links outward. The 35-market median google.com share was 7.4% (our calculation), and in 15 of the 24 service and software markets google.com held 5% or less.
One nuance: ChatGPT cited google.com more than AI Mode did in 3 markets, electrical services (5.8% vs 1.8%), family law (2.7% vs 0.3%) and personal injury law (1.6% vs 0.8%). Findrix does not break google.com down by page type, so we cannot say which Google pages those links were.
AI Mode Link Statistics by Industry Group
In the table below, we group the 35 markets into six industries and estimate how many links to sites other than google.com a typical AI Mode answer carries in each.
| Industry group | Markets | Questions | Median google.com share of AI Mode citations | Range across markets | Estimated links to other sites per AI Mode answer |
|---|---|---|---|---|---|
| Physical products | 11 | 8,800 | 61.3% | 13.2% to 70.4% | 1.4 |
| Home services | 7 | 2,800 | 8.4% | 1.8% to 13.4% | 3.4 |
| Healthcare | 6 | 2,400 | 4.2% | 2.6% or less to 20.8% | 3.5 |
| Software | 4 | 1,600 | 4.0% or less | 4.0% or less in all 4 | 3.6 or more |
| Legal | 4 | 1,600 | 3.0% or less | 3.0% or less in all 4 | 3.6 or more |
| Finance | 3 | 1,200 | 3.1% or less | 3.1% or less in all 3 | 3.6 or more |
Source: Driven Metrics analysis of Findrix Radar market pages (35 US markets) and Findrix’s October 2026 links-per-answer figure. All figures are our calculations. Note: Estimated links to other sites = 3.7 cited URLs per AI Mode answer × (1 − median google.com share). The 3.7 average covers 39 niches in the US and Australia, not each market, so treat these as estimates. For software, legal and finance, google.com was missing from some top-12 lists, so we report ceilings rather than medians.
Key Findings
- A typical AI Mode answer in a physical-product market carried an estimated 1.4 links to sites other than google.com in October 2026, against 3.4 in home services and 3.5 in healthcare (our calculation, estimate).
- The cap is structural. With about 3.7 cited links per AI Mode answer, there are only a few slots to begin with, and in product markets Google’s own pages fill most of them.
- For a retailer or brand, the outside slots in AI Mode are scarce enough that being one of them matters more than ranking for a dozen related keywords.
AI Mode Product Answers: Google Shopping and Google-Only Answers
In the table below, we compare two Findrix measures for the five product categories Search Engine Land reported: the share of AI Mode answers that linked only to Google pages, and google.com’s share of all AI Mode citations in the same market.
| Category | AI Mode answers linking only to Google pages | google.com share of AI Mode citations | Difference (points) |
|---|---|---|---|
| Swimwear and resortwear | 60.4% | 70.4% | +10.0 |
| Women’s everyday fashion | 57.0% | 68.0% | +11.0 |
| Sun care and self-tanning | 54.1% | 66.1% | +12.0 |
| Activewear | 53.8% | 67.7% | +13.9 |
| Sports nutrition and supplements | 7.6% | 13.2% | +5.6 |
Source: Driven Metrics analysis of Findrix data reported by Search Engine Land (October 29, 2026) and Findrix Radar market pages, captured November 3, 2026. Note: The two columns measure different things. The first counts answers in which every link pointed to a Google page. The second is google.com’s share of all citations in the market.
Key Findings
- Swimwear had the highest Google-only rate, 60.4% of AI Mode answers in October 2026, and google.com took 70.4% of AI Mode citations in the same market.
- The citation share ran 5.6 to 13.9 points higher than the Google-only rate in every category (our calculation), which means many answers that did include an outside link still included Google links too.
- Sports nutrition is the exception worth watching: only 7.6% of answers were Google-only and google.com held 13.2% of citations, while amazon.com took 8.5% of AI Mode citations, its highest share in any of the 35 markets.
A separate, much smaller sample points the same way. GrowByData tracked 3 running-shoe prompts in New York from September 15 to 21, 2026 and found that 71 of 130 AI Mode product placements, 54.6%, pointed to a Google Shopping product page (our calculation), within 2.4 points of Findrix’s 57% figure.
AI Mode Links for Local Services
In the table below, we show where Google AI Mode sent its links in the 7 US home service markets Findrix measured, from October 14 to 17, 2026.
| Market | google.com share of AI Mode citations | Top non-Google domain in AI Mode (share) | YouTube, Facebook and Reddit combined |
|---|---|---|---|
| Heating and air conditioning | 13.4% | modernize.com (5.0%) | 7.4% |
| Pool and spa services | 11.4% | thumbtack.com (11.6%) | 8.1% |
| Roofing | 8.7% | roofingcontractor.com (4.9%) | 4.5% |
| Solar and battery installation | 8.4% | forbes.com (5.4%) | 3.1% |
| Plumbing services | 7.4% | rotorooter.com (9.0%) | 9.2% |
| Pest control and wildlife removal | 7.2% | terminix.com (13.4%) | 2.3% |
| Electrical services | 1.8% | fsg.com (6.1%) | 9.3% |
Source: Driven Metrics analysis of Findrix Radar market pages for home services, captured November 3, 2026. Note: The combined column adds the AI Mode shares of youtube.com, facebook.com and reddit.com where they appear in the market’s top 12 domains; a platform outside the top 12 counts as zero, so these are floors.
Key Findings
- google.com took between 1.8% and 13.4% of AI Mode citations in home service markets in October 2026, a median of 8.4% (our calculation), far below the product markets.
- AI Mode filled the rest with a mix of brand sites, lead directories and social platforms. Thumbtack took 11.6% of AI Mode citations in pool and spa services, and Terminix took 13.4% in pest control.
- For a local business, that leaves room to be linked, but mostly through the places AI Mode trusts: directories, YouTube, Facebook and Reddit, which together held up to 9.3% of AI Mode citations in a single home service market.
Findrix’s own local-services figure, 5.1% of AI Mode links going to Google pages, is lower than our 8.4% home services median. The two use different groupings: Findrix’s local services figure also covers lawyers and dentists, and our median covers only the 7 home service markets. Findrix has not published which markets make up its local services group.
Where ChatGPT and Gemini Send Product Links Instead
In the table below, we list the top non-Google domain for each engine in the 11 physical-product markets, from October 14 to 17, 2026.
| Market | google.com share in AI Mode | AI Mode top other domain | ChatGPT top domain | Gemini top domain |
|---|---|---|---|---|
| Swimwear and resortwear | 70.4% | amazon.com (2.2%) | nordstrom.com (6.1%) | forbes.com (9.8%) |
| Women’s everyday fashion | 68.0% | nytimes.com (3.2%) | quince.com (7.4%) | forbes.com (11.0%) |
| Activewear | 67.7% | reddit.com (4.5%) | reddit.com (6.4%) | irunfar.com (6.4%) |
| Sun care and self-tanning | 66.1% | byrdie.com (3.5%) | ulta.com (14.6%) | whowhatwear.com (8.7%) |
| Haircare | 63.4% | allure.com (5.3%) | ulta.com (19.1%) | whowhatwear.com (9.3%) |
| Makeup and cosmetics | 61.3% | allure.com (6.7%) | ulta.com (23.7%) | whowhatwear.com (15.1%) |
| Jewelry | 59.7% | reddit.com (2.6%) | nordstrom.com (5.4%) | ajluxe.com (7.8%) |
| Facial skincare | 58.6% | allure.com (4.5%) | ulta.com (17.1%) | ulta.com (7.6%) |
| Oral care products | 49.4% | amazon.com (4.2%) | walmart.com (15.3%) | dentalartsofatlantis.com (5.8%) |
| Pet food and nutrition | 48.8% | reddit.com (3.7%) | chewy.com (16.1%) | petmd.com (8.7%) |
| Sports nutrition and supplements | 13.2% | amazon.com (8.5%) | nih.gov (8.7%) | garagegymreviews.com (9.2%) |
Source: Driven Metrics analysis of Findrix Radar market pages for physical-product markets, captured November 3, 2026. Note: Shares are each domain’s share of that engine’s citations in the market.
Key Findings
- ChatGPT’s most-cited domain was a retailer in 8 of 11 product markets in October 2026, led by ulta.com with 23.7% of ChatGPT’s citations in makeup and cosmetics (our calculation).
- Gemini leaned on publishers and review sites instead, such as forbes.com and whowhatwear.com, and Gemini gave google.com 0.1% or less of its citations in all 11 product markets.
- The same product question can send a shopper to Google Shopping, a big retailer or a magazine depending on the engine, so one blended AI visibility score hides where the traffic actually goes.
Search Engine Land also reported that ChatGPT linked to Walmart in 45.1% of its product answers and Amazon in 6.1%, and that none of Gemini’s measured links went to google.com. Findrix’s market pages show google.com at 0.9% of Gemini citations in plumbing and 0.1% in oral care, so that statement likely rests on a narrower definition of Google pages.
How AI Mode Displays Its Links
In the table below, we summarize what published studies and Google’s own updates show about where AI Mode places links, from June 2025 to October 2026.
| Source and date | What it measured | Finding |
|---|---|---|
| SE Ranking, Jun 20, 2025 | 122,617 links in 9,734 US AI Mode answers | 90.8% in the source panel beside the answer, 8.9% inline in the text, 0.3% as search-result style links |
| Semrush, published Jul 21, 2025 | 5,000 keywords | 92% of answers had a link sidebar, 7% had extra links below the answer, 1.7% had no links |
| Findrix, Oct 14 to 19, 2026 | 38,400 buyer questions | 95% of AI Mode answers had at least one link, vs 99.9% for ChatGPT and 87% for Gemini |
| Profound, Apr 15 to Jun 30, 2026 | AI Mode citations by domain | google.com’s share of AI Mode citations rose 8.4 times, making it the No. 2 cited domain, driven by Business Profile and product panel pages |
| Google, via Search Engine Roundtable, May 7, 2026 | Product change | More links placed inline in AI Mode and AI Overviews, hover previews on desktop, and suggested next-step links at the end of answers |
Source: Driven Metrics analysis of SE Ranking, Semrush, Findrix, Profound and Search Engine Roundtable, November 2026.
Key Findings
- In SE Ranking’s June 2025 sample, 90.8% of AI Mode’s 122,617 links sat in the source panel beside the answer and 8.9% sat inline in the text.
- Google has been moving links into the answer itself. On May 7, 2026 it added more inline links, hover previews and next-step links to AI Mode and AI Overviews, so placement figures from 2025 likely understate inline links in late 2026.
- Profound measured google.com’s share of AI Mode citations rising 8.4 times from April 15 to June 30, 2026, which fits the pattern in our October data: Google’s own Business Profile and product panels now take many of the slots.
For more on how Google’s AI features choose their sources, see our AI Overviews citations statistics and our breakdown of Google AI Mode ads, which now compete for the same space in AI Mode answers.
What AI Mode Link Statistics Mean for Brands in 2027
The October 2026 data splits AI Mode in two. For products, AI Mode works more like a storefront than a search engine: Google’s own pages took a median 61.3% of citations in product markets, and the answer carries only about 1 to 1.5 outside links. For services, software, legal and finance, AI Mode still sends most of its few links to outside sites.
Two things are worth watching. Google added more inline links in May 2026, and Profound saw google.com’s share climb fast through June, so the share of links that stay on Google could move in either direction by mid-2027. And sports nutrition, where AI Mode still links out far more than in fashion, is the category to watch for a shift.
So if you are comparing AI visibility reports, ask two things of every number: which engine it came from, and where the link actually went.
Data Collection and Methodology
Unit of analysis and sample. One row in our dataset is one domain in one US market, with its share of citations on ChatGPT, Gemini and Google AI Mode. We captured the “most cited domains” table from all 35 US market pages in Findrix Radar on November 3, 2026, for 420 rows (12 domains per market). Those 35 markets hold 18,400 buyer questions (24 markets with 400 questions and 11 with 800), each asked once to each engine from October 14 to 17, 2026, for 55,198 answers. These totals match the study Search Engine Land reported on October 29, 2026.
Inclusion rules. We included every US market Findrix published, and no Australian markets. We excluded Perplexity, Claude and other engines because Findrix did not publish them for these markets. Outside benchmarks were included only if they reported links or citations per answer, or link destinations, for Google AI Mode with a stated date.
Definitions. A citation or link is a URL an engine shows with its answer, inline or in a source list. Citation share is a domain’s share of all citations one engine gave across a market’s questions, as defined by Findrix. “google.com” is the domain as Findrix reports it and may include Google Shopping product pages, Business Profiles and other Google search pages. Groups: physical products (fashion, beauty, sports nutrition, pet food), home services, healthcare, legal, finance and software, following Findrix’s own categories.
Calculations. Median google.com share by group = median of the market values in the group. Where google.com was missing from a market’s top 12, we used the lowest-listed share as a ceiling; Findrix sorts each table by a domain’s highest share on any engine, which we confirmed for all 35 markets. Estimated links to other sites per AI Mode answer = 3.7 × (1 − google.com share ÷ 100). ChatGPT links per AI Mode link = ChatGPT links per answer ÷ AI Mode links per answer. Difference in points = google.com citation share − Google-only answer rate.
Rounding and firmness. Shares are shown to one decimal as published. Cells Findrix shows as “<0.1%” were treated as 0.05%, and “1×” (a single citation) and “–” (none) as 0 in our math. All market data is disclosed by Findrix; the 3.7 links-per-answer figure covers 39 niches in the US and Australia, so per-market link estimates are estimates.
Limits of the data
- Each question was asked once per engine, so individual market figures carry run-to-run noise. Findrix says about a tenth of AI citation outcomes vary by chance.
- Findrix publishes only the top 12 domains per market, so we cannot see the full distribution or google.com’s exact share in 10 markets.
- google.com is not split by page type, so we cannot separate Google Shopping, Maps, Business Profiles and search pages within it.
- Links-per-answer figures come from different samples and counting methods. Treat cross-study comparisons as ranges, not precise ratios.
- The data shows which links were displayed, not which were clicked or what anyone bought.
- AI Mode changes often. Google updated link placement in May 2026, so this is a snapshot of October 2026.
Download the dataset (CSV). To request the full dataset or a PDF copy of this report, contact Driven Metrics.
Further Reading
- AI Overviews Citations Statistics 2026
- Google AI Mode Ads Statistics 2026
- AI Referral Traffic Statistics 2026
- Zero-Click Search Statistics 2026
About the Author
Emily Connor is the Founder and CEO of Driven Metrics, an SEO and generative engine optimization agency. She works with brands on keyword strategy, AI visibility tracking and content that AI tools cite. Learn more about Driven Metrics.
Sources
- Driven Metrics analysis of Findrix Radar citation data for 35 US markets (420 market-domain rows), October 14 to 17, 2026, conducted November 2026. Dataset: ai-mode-link-statistics-dataset.csv.
- Findrix. Findrix Radar: Who AI recommends, market by market. October 2026. Accessed November 3, 2026. https://www.findrix.ai/radar
- Findrix. Findrix Radar, United States market pages (35 markets). Measured October 14 to 17, 2026. Accessed November 3, 2026. https://www.findrix.ai/radar/us
- Zemlyanskaya, Evgeniya. How AI Search Engines Retrieve and Cite Sources. Findrix, October 29, 2026. https://www.findrix.ai/blog/how-ai-search-engines-retrieve-and-cite-sources
- Goodwin, Danny. Google AI Mode sends 57% of product links to Google Shopping: Study. Search Engine Land, October 29, 2026. https://searchengineland.com/google-ai-mode-product-links-google-shopping-study-499887
- LLM Pulse. Average citations per response by AI model. Updated November 1, 2026. Accessed November 3, 2026. https://llmpulse.ai/data-studies/avg-citations-per-response
- SE Ranking. AI Mode research: volatility, source patterns and differences from AIO and organic results (German-language edition). October 16, 2025, updated November 19, 2025. https://seranking.com/de/blog/ai-mode-studie/
- Levin, Eugene. How Google’s AI Mode Compares to Traditional Search and Other LLMs. Semrush, July 21, 2025. https://semrush.com/blog/ai-mode-comparison-study
- GrowByData. AI Shopping Visibility: How to Track Which Products ChatGPT, AI Mode and Perplexity Recommend. October 8, 2026. https://growbydata.com/ai-shopping-visibility/
- McCain, Davis. Google AI Mode’s shift to citing itself. Profound, July 14, 2026. https://www.tryprofound.com/blog/google-com-is-now-ai-mode-s-2-cited-domain
- Search Engine Roundtable. Google Improves Links Within AI Mode & AI Overviews In 5 Ways. May 7, 2026. https://www.seroundtable.com/google-improves-links-ai-mode-ai-overviews-41280.html
Driven Metrics research · November 2026
By Emily Connor, Founder and CEO, Driven Metrics · Published November 2026 · Updated November 2026